The chart below provides the results of a 4th grade class on this years standardized test. Class Average National Average Standard Deviation Math 79.2 77.1 9.4 Reading 83.5 $4.7 10.1 a. Determine the z-score for both math and reading:
The chart below provides the results of a 4th grade class on this years standardized test. Class Average National Average Standard Deviation Math 79.2 77.1 9.4 Reading 83.5 $4.7 10.1 a. Determine the z-score for both math and reading:

Glencoe Algebra 1, Student Edition, 9780079039897, 0079039898, 2018
18th Edition
ISBN:9780079039897
Author:Carter
Publisher:Carter
Chapter10: Statistics
Section10.5: Comparing Sets Of Data
Problem 13PPS

Related questions
Question
100%
The problem is in the photo provided
Please answer all parts
Thank you
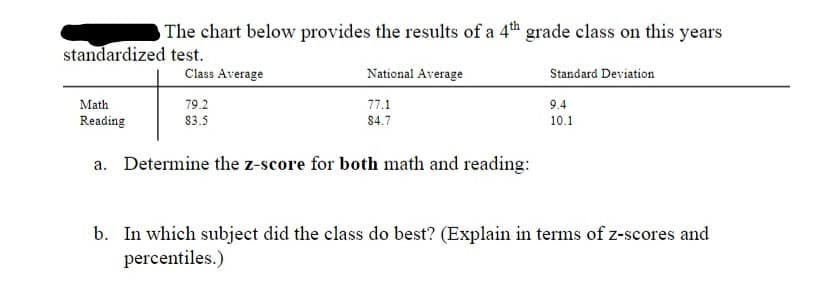
Transcribed Image Text:The chart below provides the results of a 4th grade class on this years
standardized test.
Class Average
National Average
Standard Deviation
Math
Reading
79.2
77.1
9.4
83.5
84.7
10.1
a. Determine the z-score for both math and reading:
b. In which subject did the class do best? (Explain in terms of z-scores and
percentiles.)
Expert Solution
This question has been solved!
Explore an expertly crafted, step-by-step solution for a thorough understanding of key concepts.

This is a popular solution!

Trending now
This is a popular solution!

Step by step
Solved in 2 steps with 2 images

Knowledge Booster


Learn more about
Need a deep-dive on the concept behind this application? Look no further. Learn more about this topic, statistics and related others by exploring similar questions and additional content below.Recommended textbooks for you
Glencoe Algebra 1, Student Edition, 9780079039897…
Algebra
ISBN:
9780079039897
Author:
Carter
Publisher:
McGraw Hill
Glencoe Algebra 1, Student Edition, 9780079039897…
Algebra
ISBN:
9780079039897
Author:
Carter
Publisher:
McGraw Hill