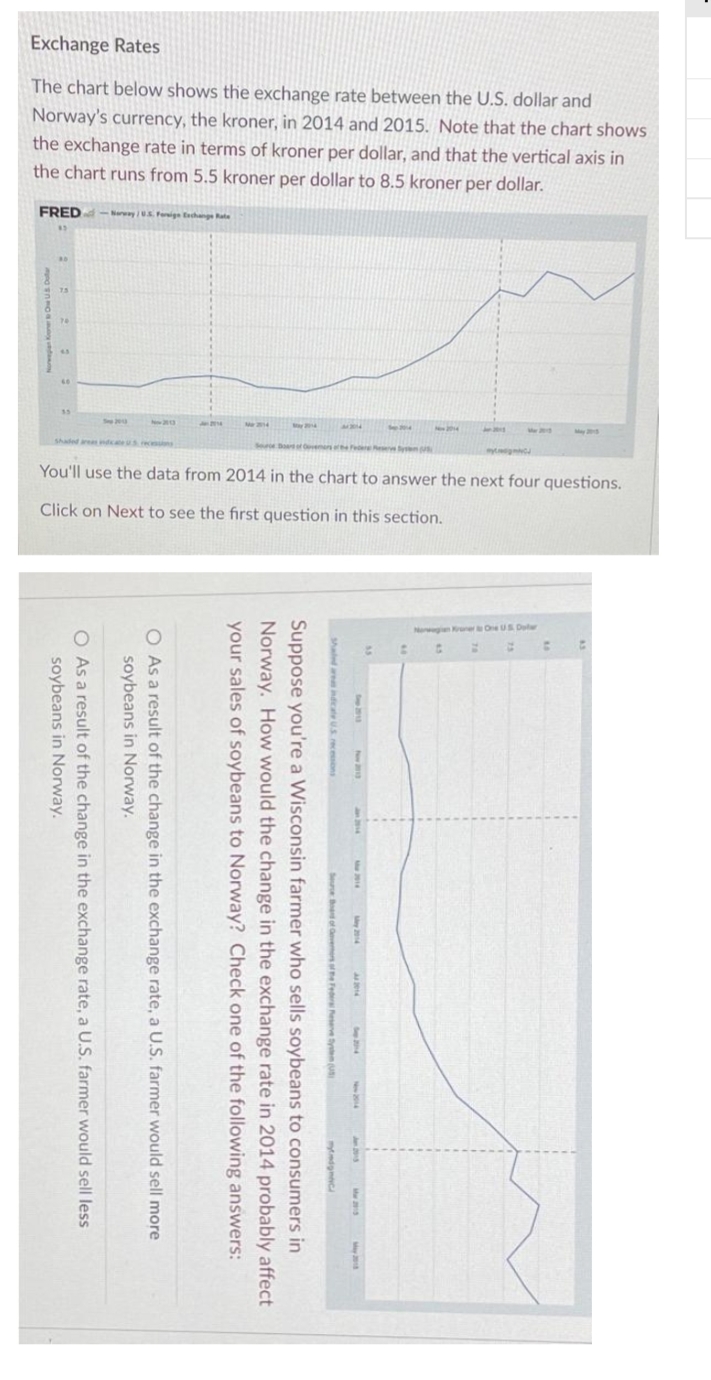
The chart below shows the exchange rate between the U.S. dollar and Norway's currency, the kroner, in 2014 and 2015. Note that the chart shows the exchange rate in terms of kroner per dollar, and that the vertical axis in the chart runs from 5.5 kroner per dollar to 8.5 kroner per dollar. FRED SorwayUS Foreign Exchange Rate 43
The chart below shows the exchange rate between the U.S. dollar and Norway's currency, the kroner, in 2014 and 2015. Note that the chart shows the exchange rate in terms of kroner per dollar, and that the vertical axis in the chart runs from 5.5 kroner per dollar to 8.5 kroner per dollar. FRED SorwayUS Foreign Exchange Rate 43

Fundamentals Of Financial Management, Concise Edition (mindtap Course List)
10th Edition
ISBN:9781337902571
Author:Eugene F. Brigham, Joel F. Houston
Publisher:Eugene F. Brigham, Joel F. Houston
Chapter17: Multinational Financial Management
Section: Chapter Questions
Problem 6P

Related questions

Question
Transcribed Image Text:New Krone to One US Dol
20
section.
Norway's currency, the kroner, in 2014 and 2015. Note that the chart shows
The chart below shows the exchange rate between the U.S. dollar and
the exchange rate in terms of kroner per dollar, and that the vertical axis in
the chart runs from 5.5 kroner per dollar to 8.5 kroner per dollar.
You'll use the data from 2014 in the chart to answer the next four questions.
Click on Next to see the first question in this
Exchange Rates
FRED- U.S. Foreign Exchange Rate
Norwegian Kroner to Ow US Do
PAD
Hmotn
55
A 2014
Shaled areas indicate US recessions
Source Board of Governors of the Federal Reserve System (US)
myndignaci
Suppose you're a Wisconsin farmer who sells soybeans to consumers in
Norway. How would the change in the exchange rate in 2014 probably affect
your sales of soybeans to Norway? Check one of the following answers:
O As a result of the change in the exchange rate, a U.S. farmer would sell more
soybeans in Norway.
O As a result of the change in the exchange rate, a U.S. farmer would sell less
soybeans in Norway.
Expert Solution
This question has been solved!
Explore an expertly crafted, step-by-step solution for a thorough understanding of key concepts.

This is a popular solution!

Trending now
This is a popular solution!

Step by step
Solved in 2 steps

Knowledge Booster


Learn more about
Need a deep-dive on the concept behind this application? Look no further. Learn more about this topic, finance and related others by exploring similar questions and additional content below.Recommended textbooks for you
Fundamentals Of Financial Management, Concise Edi…
Finance
ISBN:
9781337902571
Author:
Eugene F. Brigham, Joel F. Houston
Publisher:
Cengage Learning

EBK CONTEMPORARY FINANCIAL MANAGEMENT
Finance
ISBN:
9781337514835
Author:
MOYER
Publisher:
CENGAGE LEARNING - CONSIGNMENT
Fundamentals Of Financial Management, Concise Edi…
Finance
ISBN:
9781337902571
Author:
Eugene F. Brigham, Joel F. Houston
Publisher:
Cengage Learning
EBK CONTEMPORARY FINANCIAL MANAGEMENT
Finance
ISBN:
9781337514835
Author:
MOYER
Publisher:
CENGAGE LEARNING - CONSIGNMENT