The citizens of a fictional city called Kamar-Taj enjoy exceptionally good weather compared to other similar cities in the country. Let us analyze the real estate market in Kamar-Taj. The following graph shows the supply and demand for housing in Kamar-Taj. The curve labeled Supply represents the supply of housing in the city, and the curve labeled D1 represents the demand for housing if the weather were not so good. Adjust the following graph to show the position of the demand curve given that the weather is good. PRICE (Local Curency) 130 117 104 91 78 65 52 39 26 13 0 0 Supply 11 22 33 44 55 66 QUANTITY (Housing in Kamar-Taj) 77 88 99 110 Based on the graph, the price of housing 4 D 1 Supply to $
The citizens of a fictional city called Kamar-Taj enjoy exceptionally good weather compared to other similar cities in the country. Let us analyze the real estate market in Kamar-Taj. The following graph shows the supply and demand for housing in Kamar-Taj. The curve labeled Supply represents the supply of housing in the city, and the curve labeled D1 represents the demand for housing if the weather were not so good. Adjust the following graph to show the position of the demand curve given that the weather is good. PRICE (Local Curency) 130 117 104 91 78 65 52 39 26 13 0 0 Supply 11 22 33 44 55 66 QUANTITY (Housing in Kamar-Taj) 77 88 99 110 Based on the graph, the price of housing 4 D 1 Supply to $

Economics Today and Tomorrow, Student Edition
1st Edition
ISBN:9780078747663
Author:McGraw-Hill
Publisher:McGraw-Hill
Chapter7: Demand And Supply
Section: Chapter Questions
Problem 20AA

Related questions
Question
Don’t know how to solve
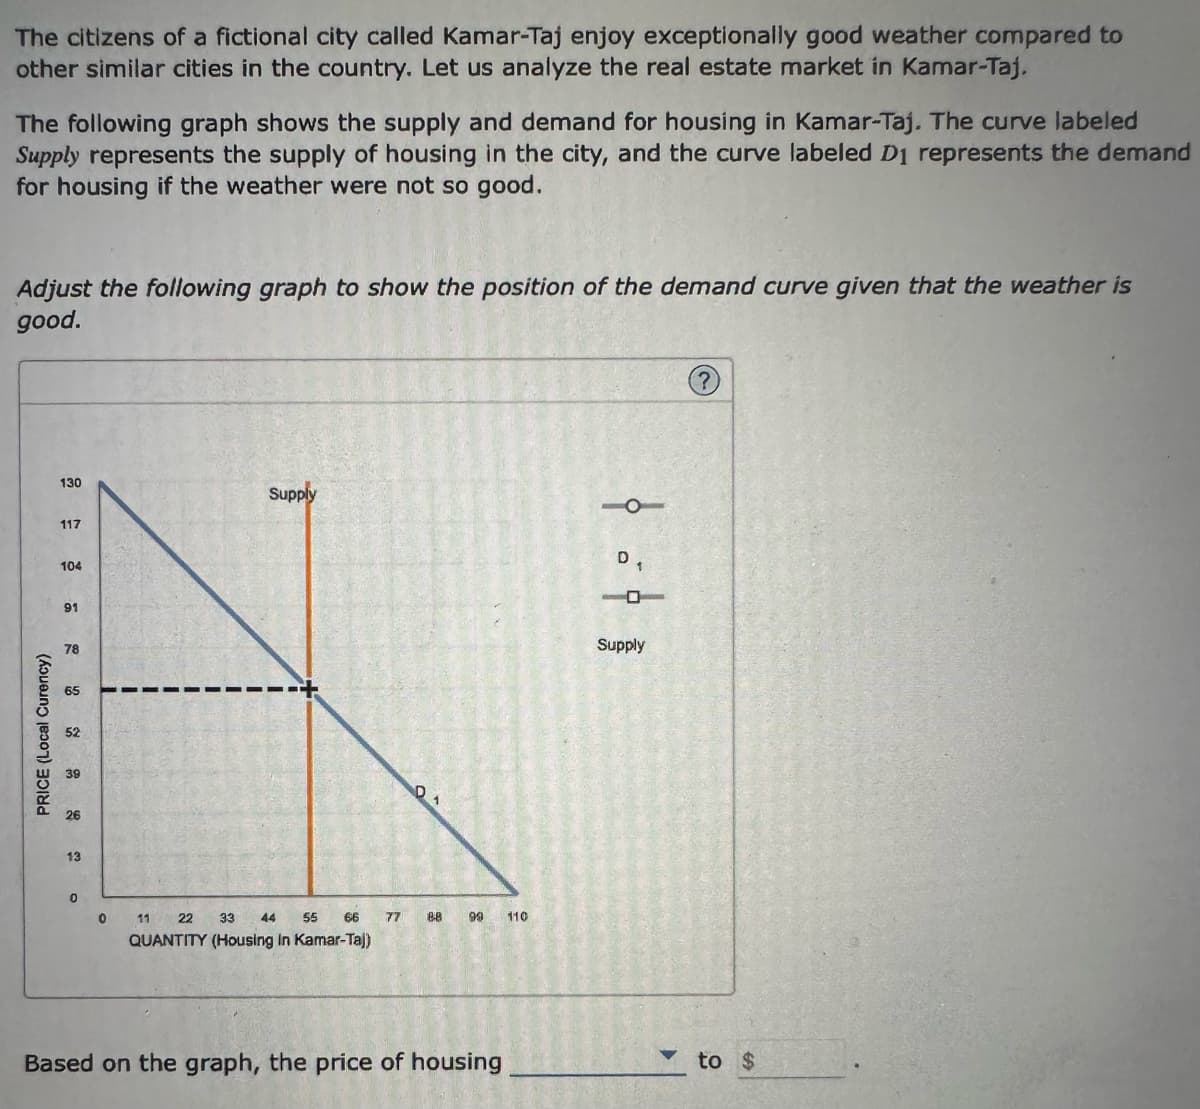
Transcribed Image Text:The citizens of a fictional city called Kamar-Taj enjoy exceptionally good weather compared to
other similar cities in the country. Let us analyze the real estate market in Kamar-Taj.
The following graph shows the supply and demand for housing in Kamar-Taj. The curve labeled
Supply represents the supply of housing in the city, and the curve labeled D1 represents the demand
for housing if the weather were not so good.
Adjust the following graph to show the position of the demand curve given that the weather is
good.
PRICE (Local Curency)
130
117
104
91
78
65
39
26
13
0
0
1927 192
N
PER
11.4
Supply
15
NOVEM
66
11 22 33 44 55
QUANTITY (Housing in Kamar-Taj)
77
D
1
88
99 110
Based on the graph, the price of housing
D,
Supply
?
to $
Expert Solution
This question has been solved!
Explore an expertly crafted, step-by-step solution for a thorough understanding of key concepts.

This is a popular solution!

Trending now
This is a popular solution!

Step by step
Solved in 2 steps with 2 images

Knowledge Booster


Learn more about
Need a deep-dive on the concept behind this application? Look no further. Learn more about this topic, economics and related others by exploring similar questions and additional content below.Recommended textbooks for you
Economics Today and Tomorrow, Student Edition
Economics
ISBN:
9780078747663
Author:
McGraw-Hill
Publisher:
Glencoe/McGraw-Hill School Pub Co

Exploring Economics
Economics
ISBN:
9781544336329
Author:
Robert L. Sexton
Publisher:
SAGE Publications, Inc

Principles of Economics 2e
Economics
ISBN:
9781947172364
Author:
Steven A. Greenlaw; David Shapiro
Publisher:
OpenStax
Economics Today and Tomorrow, Student Edition
Economics
ISBN:
9780078747663
Author:
McGraw-Hill
Publisher:
Glencoe/McGraw-Hill School Pub Co
Exploring Economics
Economics
ISBN:
9781544336329
Author:
Robert L. Sexton
Publisher:
SAGE Publications, Inc
Principles of Economics 2e
Economics
ISBN:
9781947172364
Author:
Steven A. Greenlaw; David Shapiro
Publisher:
OpenStax

Essentials of Economics (MindTap Course List)
Economics
ISBN:
9781337091992
Author:
N. Gregory Mankiw
Publisher:
Cengage Learning

Brief Principles of Macroeconomics (MindTap Cours…
Economics
ISBN:
9781337091985
Author:
N. Gregory Mankiw
Publisher:
Cengage Learning
