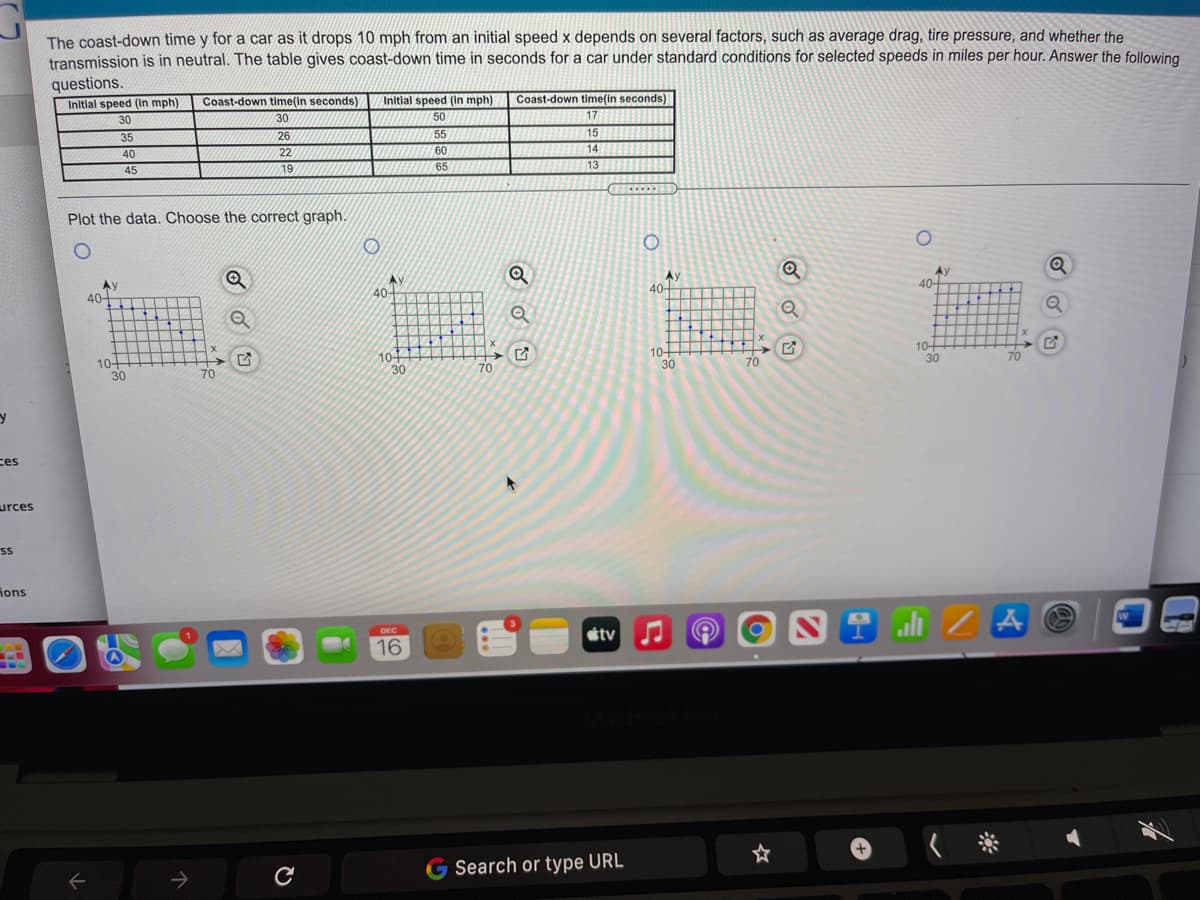
The coast-down time y for a car as it drops 10 mph from an initial speed x depends on several factors, such as average drag, tire pressure, and whether the transmission is in neutral. The table gives coast-down time in seconds for a car under standard conditions for selected speeds in miles per hour. Answer the following questions. Coast-down time(in seconds) Initial speed (in mph) Coast-down time(in seconds) Initial speed (In mph) 30 30 50 35 26 55 15 40 22 60 14 45 19 65 13 Plot the data. Choose the correct graph. Ay 40- Ay 40- Ay 40- 40- 10- 30 10+ 30 70 10 30 10+ 30 70 70
The coast-down time y for a car as it drops 10 mph from an initial speed x depends on several factors, such as average drag, tire pressure, and whether the transmission is in neutral. The table gives coast-down time in seconds for a car under standard conditions for selected speeds in miles per hour. Answer the following questions. Coast-down time(in seconds) Initial speed (in mph) Coast-down time(in seconds) Initial speed (In mph) 30 30 50 35 26 55 15 40 22 60 14 45 19 65 13 Plot the data. Choose the correct graph. Ay 40- Ay 40- Ay 40- 40- 10- 30 10+ 30 70 10 30 10+ 30 70 70

Functions and Change: A Modeling Approach to College Algebra (MindTap Course List)
6th Edition
ISBN:9781337111348
Author:Bruce Crauder, Benny Evans, Alan Noell
Publisher:Bruce Crauder, Benny Evans, Alan Noell
Chapter5: A Survey Of Other Common Functions
Section5.3: Modeling Data With Power Functions
Problem 9E

Related questions
Question
13 3.4
Transcribed Image Text:The coast-down time y for a car as it drops 10 mph from an initial speed x depends on several factors, such as average drag, tire pressure, and whether the
transmission is in neutral. The table gives coast-down time in seconds for a car under standard conditions for selected speeds in miles per hour. Answer the following.
questions.
Initial speed (In mph)
Coast-down time(in seconds)
Initial speed (in mph)
50
Coast-down time(in seconds)
30
30
17
35
26
15
14
55
40
22
60
45
19
65
13
...
Plot the data. Choose the correct graph.
Ay
40-
40
Ay
40-
Ay
40-
-
10+
30
104
30
10-
30
10-
30
70
70
70
70
ces
urces
ions
DEC
etv
16
G
Search or type URL
Expert Solution
This question has been solved!
Explore an expertly crafted, step-by-step solution for a thorough understanding of key concepts.

This is a popular solution!

Trending now
This is a popular solution!

Step by step
Solved in 2 steps with 1 images

Recommended textbooks for you
Functions and Change: A Modeling Approach to Coll…
Algebra
ISBN:
9781337111348
Author:
Bruce Crauder, Benny Evans, Alan Noell
Publisher:
Cengage Learning

Algebra & Trigonometry with Analytic Geometry
Algebra
ISBN:
9781133382119
Author:
Swokowski
Publisher:
Cengage

Holt Mcdougal Larson Pre-algebra: Student Edition…
Algebra
ISBN:
9780547587776
Author:
HOLT MCDOUGAL
Publisher:
HOLT MCDOUGAL
Functions and Change: A Modeling Approach to Coll…
Algebra
ISBN:
9781337111348
Author:
Bruce Crauder, Benny Evans, Alan Noell
Publisher:
Cengage Learning
Algebra & Trigonometry with Analytic Geometry
Algebra
ISBN:
9781133382119
Author:
Swokowski
Publisher:
Cengage
Holt Mcdougal Larson Pre-algebra: Student Edition…
Algebra
ISBN:
9780547587776
Author:
HOLT MCDOUGAL
Publisher:
HOLT MCDOUGAL