The Coca-Cola Company introduced New Coke in 1985. Within three months of this introduction, negative consumer reaction forced Coca-Cola to reintroduce the original formula of Coke as Coca-Cola Classic. Suppose that two years later, in 1987, a marketing research firm in Chicago compared the sales of Coca-Cola Classic, New Coke, and Pepsi in public building vending machines. To do this, the marketing research firm randomly selected 10 public buildings in Chicago having both a Coke machine (selling Coke Classic and New Coke) and a Pepsi machine. The Coca-Cola Data and a MINITAB Output of a Randomized Block ANOVA of the Data: 1 2 Building 3. 4 5 6. 7. 6. 10 Coke Classic New Coke Pepsi 46 133 123 41 152 35 62 217 122 86 4 114 27 64 15 82 110 36 48 10 39 146 52 43 62 130 53 143 71 98 Two-way ANOVA: Cans versus Drink, Building F. Source Drink DF 2 8,147.4 4,073.70 5. 68 .012 SS MS Building 9 53,434.8 5,937.20 8.28 Error Total 000 12,914.6 29 74,496.8 18 717.48 Descriptive Statistics: Cans Mean Variable Drink Coke Classic New Coke Pepsi Cans 101.7 63.6 71.1 (a-1) Calculate the value of the test statistic and p-value. (Round "test statistic" value to 2 decimal places and "p value" to 3 decimal places.) Test 5.68 statistic p-value 0.012 (a-2) At the O.05 significance level, what is the conclusion? * Reject HO Do not reject HO (b) What is the Tukey simultaneous 95 percent confidence interval for the following? (Negative amounts should be indicated by a minus sign. Round your answers to 2 decimal places.) Confidence Interval Coke Classic - New Coke Coke Classic-Pepsi New Coke - Pepsi 7.98


Trending now
This is a popular solution!

Step by step
Solved in 3 steps

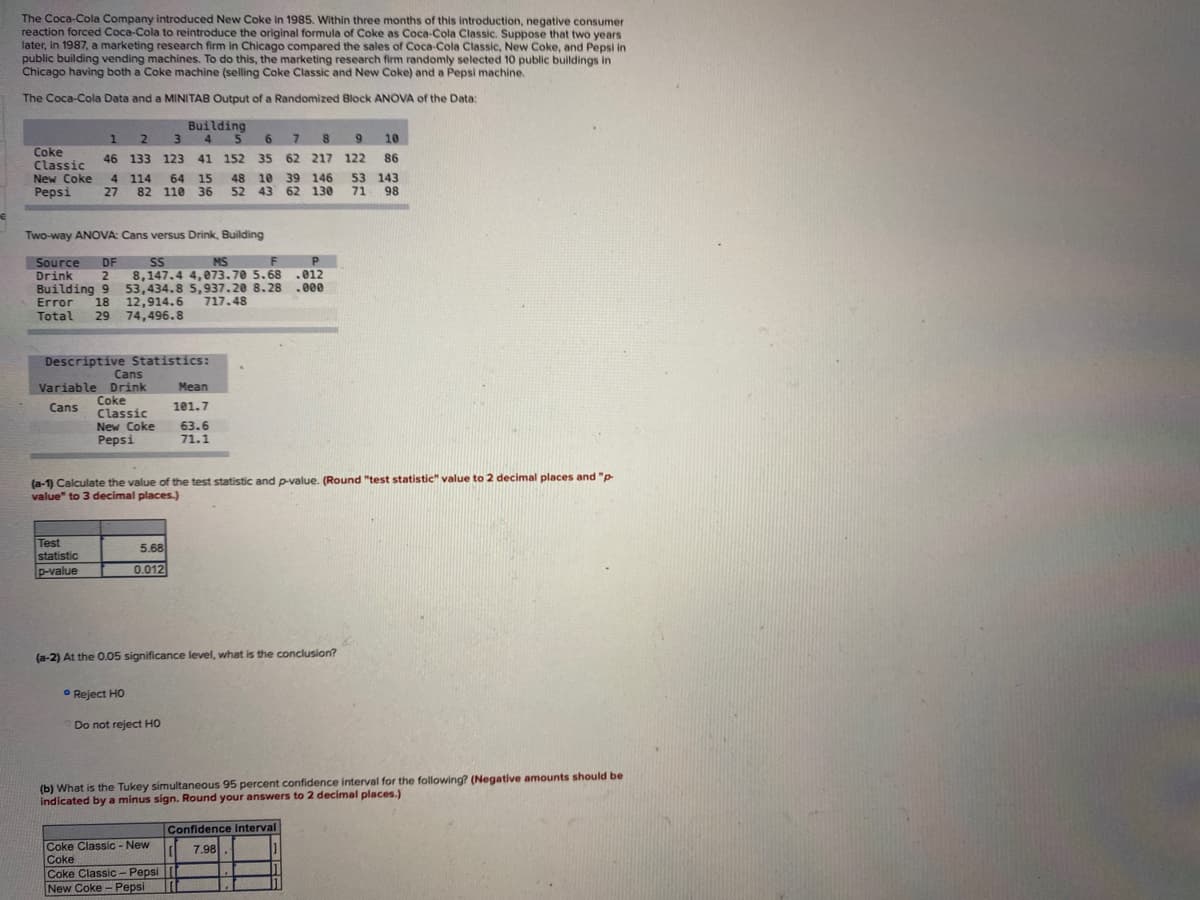
The Coca-Cola Company introduced New Coke in 1985. Within three months of this introduction, negative consumer reaction forced Coca-Cola to reintroduce the original formula of Coke as Coca-Cola Classic. Suppose that two years later, in 1987, a marketing research firm in Chicago compared the sales of Coca-Cola Classic, New Coke, and Pepsi in public building vending machines. To do this, the marketing research firm randomly selected 10 public buildings in Chicago having both a Coke machine (selling Coke Classic and New Coke) and a Pepsi machine.
The Coca-Cola Data and a MINITAB Output of a Randomized Block ANOVA of the Data:
| Building | ||||||||||
| 1 | 2 | 3 | 4 | 5 | 6 | 7 | 8 | 9 | 10 | |
| Coke Classic | 42 | 133 | 131 | 50 | 148 | 33 | 64 | 210 | 106 | 86 |
| New Coke | 6 | 110 | 54 | 12 | 43 | 11 | 34 | 160 | 57 | 147 |
| Pepsi | 33 | 95 | 105 | 45 | 45 | 45 | 76 | 122 | 79 | 96 |
Two-way ANOVA: Cans versus Drink, Building
| Source | DF | SS | MS | F | P |
| Drink | 2 | 7,208.5 | 3,604.23 | 4.59 | .024 |
| Building | 9 | 51,209.2 | 5,689.91 | 7.25 | .000 |
| Error | 18 | 14,132.2 | 785.12 | ||
| Total | 29 | 72,549.9 | |||
| Variable | Drink | Mean |
| Cans | Coke Classic | 100.3 |
| New Coke | 63.4 | |
| Pepsi | 74.1 | |
(a-1) Calculate the value of the test statistic and p-value. (Round "test statistic" value to 2 decimal places and "p-value" to 3 decimal places.)
(a-2) At the 0.05 significance level, what is the conclusion?
multiple choice
-
Reject H0
-
Do not reject H0
(b) What is the Tukey simultaneous 95 percent confidence interval for the following? (Negative amounts should be indicated by a minus sign. Round your answers to 2 decimal places.)
