The coin size data (measured in millimeters) collected from each group is shown below. Low Income High Income 14 19 23 24 29 17 17 20 18 15 23 21 19 21 17 19 17 26 25 21 25 15 23 19 24 21 17 17 24 21 24 24 11 15 18 You can copy the data into Excel by highlighting the data, right-clicking and selecting Copy, then opening Excel, clicking on a blank cell, and selecting Paste from the Edit menu. Give your answers to at least 3 decimal places accuracy. Keep the data in Excel, as you will need this information again in later questions. 2. Compute the following summary statistics
The coin size data (measured in millimeters) collected from each group is shown below. Low Income High Income 14 19 23 24 29 17 17 20 18 15 23 21 19 21 17 19 17 26 25 21 25 15 23 19 24 21 17 17 24 21 24 24 11 15 18 You can copy the data into Excel by highlighting the data, right-clicking and selecting Copy, then opening Excel, clicking on a blank cell, and selecting Paste from the Edit menu. Give your answers to at least 3 decimal places accuracy. Keep the data in Excel, as you will need this information again in later questions. 2. Compute the following summary statistics

Glencoe Algebra 1, Student Edition, 9780079039897, 0079039898, 2018
18th Edition
ISBN:9780079039897
Author:Carter
Publisher:Carter
Chapter10: Statistics
Section10.6: Summarizing Categorical Data
Problem 34PPS

Related questions
Topic Video
Question
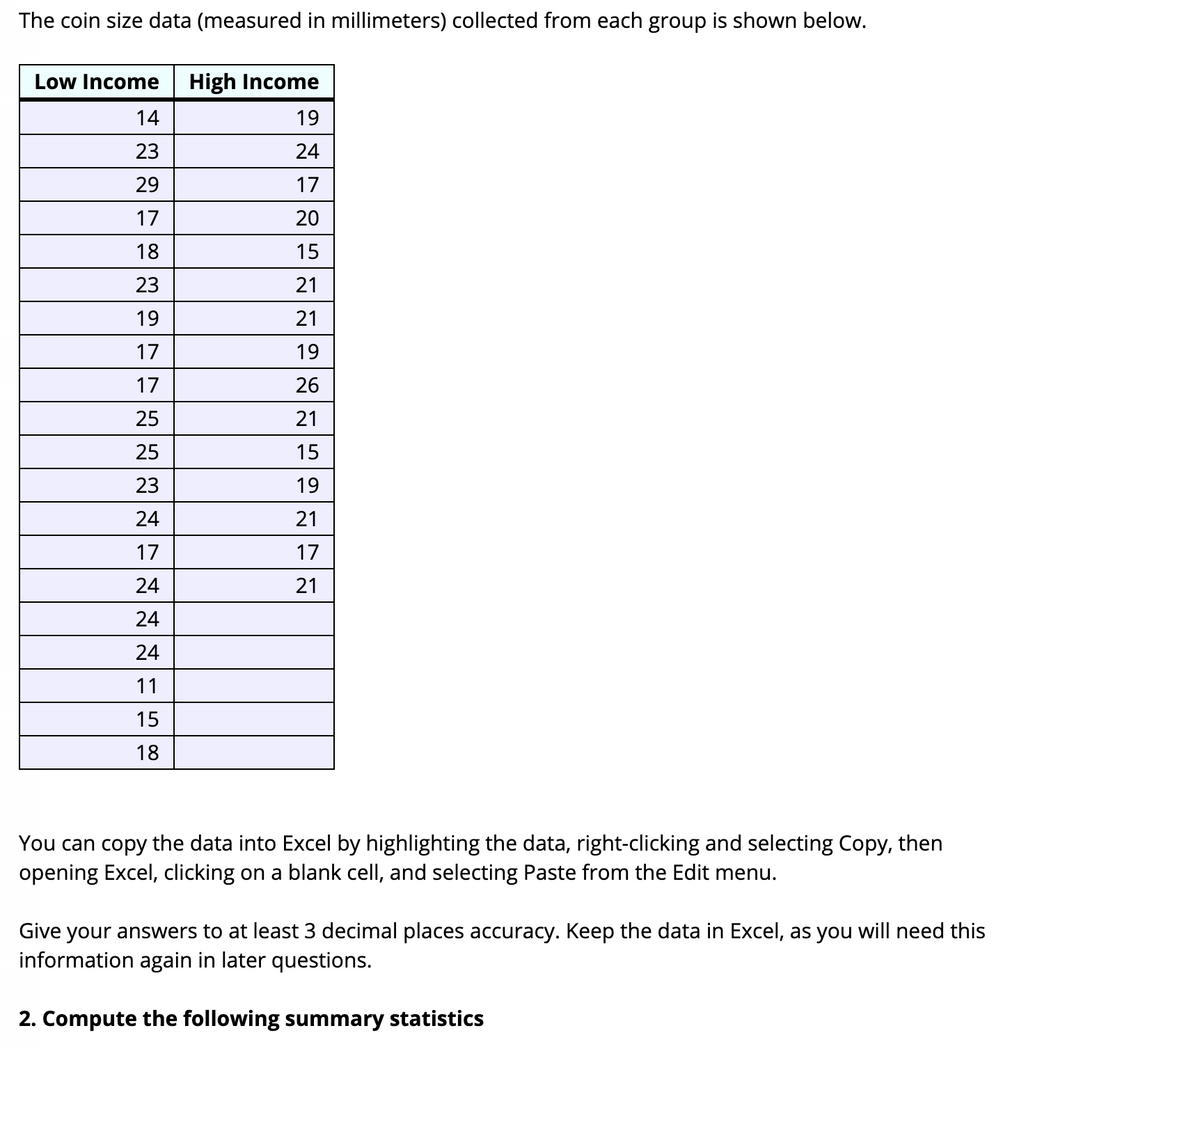
Transcribed Image Text:The coin size data (measured in millimeters) collected from each group is shown below.
Low Income
High Income
14
19
23
24
29
17
17
20
18
15
23
21
19
21
17
19
17
26
25
21
25
15
23
19
24
21
17
17
24
21
24
24
11
15
18
You can copy the data into Excel by highlighting the data, right-clicking and selecting Copy, then
opening Excel, clicking on a blank cell, and selecting Paste from the Edit menu.
Give your answers to at least 3 decimal places accuracy. Keep the data in Excel, as you will need this
information again in later questions.
2. Compute the following summary statistics
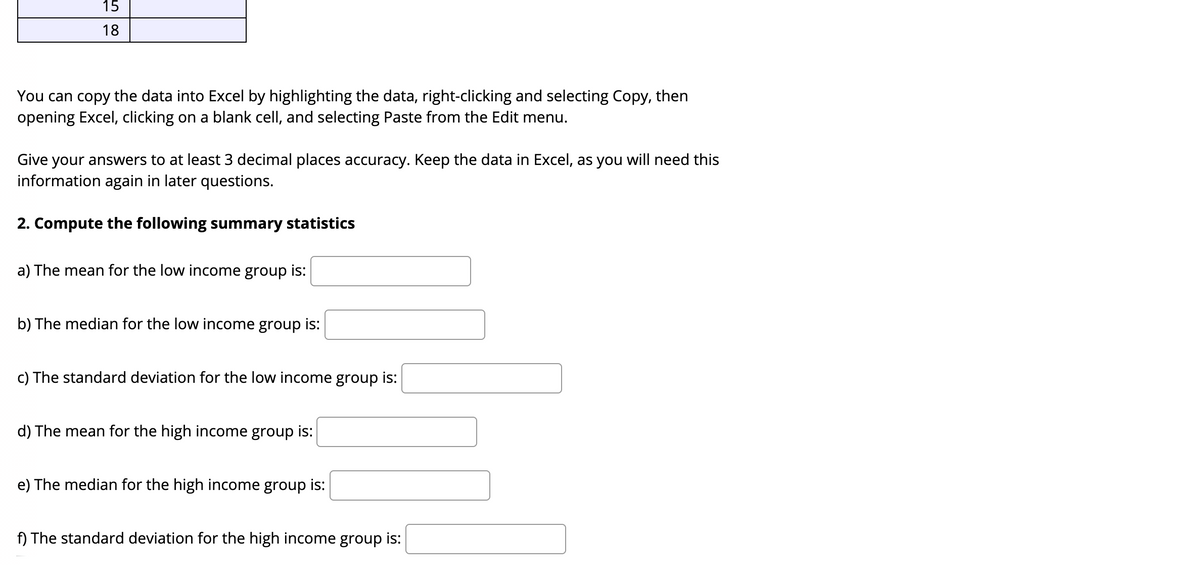
Transcribed Image Text:15
18
You can copy the data into Excel by highlighting the data, right-clicking and selecting Copy, then
opening Excel, clicking on a blank cell, and selecting Paste from the Edit menu.
Give your answers to at least 3 decimal places accuracy. Keep the data in Excel, as you will need this
information again in later questions.
2. Compute the following summary statistics
a) The mean for the low income group is:
b) The median for the low income group is:
c) The standard deviation for the low income group is:
d) The mean for the high income group is:
e) The median for the high income group is:
f) The standard deviation for the high income group is:
Expert Solution
This question has been solved!
Explore an expertly crafted, step-by-step solution for a thorough understanding of key concepts.

This is a popular solution!

Trending now
This is a popular solution!

Step by step
Solved in 2 steps with 2 images

Knowledge Booster


Learn more about
Need a deep-dive on the concept behind this application? Look no further. Learn more about this topic, statistics and related others by exploring similar questions and additional content below.Recommended textbooks for you
Glencoe Algebra 1, Student Edition, 9780079039897…
Algebra
ISBN:
9780079039897
Author:
Carter
Publisher:
McGraw Hill
Glencoe Algebra 1, Student Edition, 9780079039897…
Algebra
ISBN:
9780079039897
Author:
Carter
Publisher:
McGraw Hill