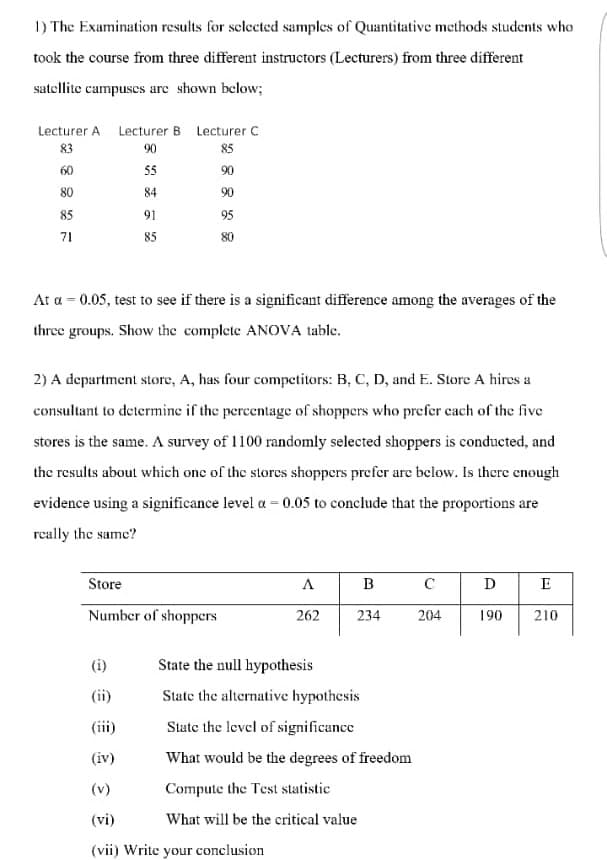
The Examination results for selected samples of Quantitative methods students who ok the course from three different instructors (Lecturers) from three different ellite campuses are shown below; ecturer A Lecturer B Lecturer C 83 90 85 60 55 90 80 84 90 85 91 95 71 85 80


Q: Using the z table in Appendix B (Table B-1), calculate the following percentages for a z score of…
A: Given that: Z is standard normal Distributed with i.e. mean µ =0 and standard deviation σ =1 By…
Q: The data shown below are the red cell folate level (ug/ l) in three groups Group 1 (n=8) 243 251…
A: The given data for the 3 groups are as follows:
Q: Using the data posted below this question, determine if the airline can claim, at a 1% significance…
A: Use the given data to form the excel table: Service time Mean 126.2783 Sum 102538 S.D…
Q: Suppose the accompanying summary statistics for a measure of social marginality for samples of…
A:
Q: Catherine is a junior reporter. As part of an investigation into consumer affairs she purchases 0.5…
A: From the provided information, The number of observations (n) = 12
Q: The following information is obtained from two independent samples selected from two populations. n…
A: Given,n1=250n2=240x¯1=5.35x¯2=4.42σ1=1.65σ2=1.63
Q: A gym trainer claims that people who goes to the gym tend to eat more food after their first day of…
A: The claim of the gym trainer is that people who join the gym eat more food after the first day. To…
Q: (a) The following data are from matched samples taken from two populations. Compute the difference…
A: Given information- We have given the data from matched samples which are taken from two populations.…
Q: The following data give the numbers of computer keyboards assembled at the Twentieth Century…
A: Formula for finding percentile rank is,
Q: 1. The following data were obtained in a study of the relationship between the weight and chest size…
A:
Q: A random sample of 12 professional athletes produced the following data, where x is the number of…
A:
Q: The following data represent the chemistry grades for a random sample of 12 freshmen at a certain…
A: Enter the given data into excel as follows:
Q: In order to determine whether the significant difference in the durability of 3makes of computers,…
A: For the given data, ANOVA will be used: Given data set: A B C 5 8 7 6 10 3 8 11 5 9 12 4…
Q: Three types of medium sized cars assembled in New Zealand have been test driven by a motoring…
A: The degrees of freedom for treatment is, df=k-1=3-1=2 The degrees of freedom for error is,…
Q: Three types of medium sized cars assembled in New Zealand have been test driven by a motoring…
A: Excel Procedure: Enter the data for A, B, C in Excel sheet>Go to Data Menu>Click on Data…
Q: A district wishes to study the relationship between class sıze (x), and achie sample of 15…
A: Solution complete the table Class, x Score, y x2 y2 xy 15 85 225 7225 1275 17 86 289…
Q: A U.S. Food Survey showed that Americans routinely eat beef in their diet. Suppose that in a study…
A: Given information Illinois Texas µ µ1 µ2 n 49 64 x̅ 54.1 lb 60.4…
Q: The following table shows the hot dogs bought from a street vendor over the course of eight days…
A: Given, SST=709.88 SSE=199.48199.48 SSR=510.40
Q: 3. Construct the scatterplots for the following bivariate data: a. b. Age of person, in years…
A:
Q: The weights of some IEM students and IEC students (two kinds of IE students) before they stopped…
A: Given: The provided data is of IEC and IEM Students. The researcher assumes that the median weight…
Q: Using the data below, calculate the correlation of these samples. Round your answer to 1 decimal…
A: The provided data set is: seed mass seedling height 5.06 7.91 5.06 7.25 5.5…
Q: The following data were obtained from a repeated-measures research study. What is the value of SS…
A: Solution: From the given information,
Q: a) Use a calculator with mean and standard deviation keys to calculate x1, s1, x2, and s2. (Round…
A: (a) We can use calculator or Excel to calculate the required values. Pasting the values in Excel and…
Q: The following data are from a random sample of thirty cases from a study by Howell & Huessx (1981).…
A: Hii ! Thanks for posting the question . Since your question has more than three subparts , we have…
Q: (b).The following data were obtained in a study of the relationship between the weight and the chest…
A: From given data, X Y X*Y X*X Y*Y 2.75 29.5 81.125 7.5625 870.25 2.15 26.3 56.545 4.6225…
Q: The administrators at Victor Valley College created a dataset that included the semester grade point…
A: Given: Sample size n = 7 Variables: GPA , Number of Units attempted
Q: The average total dollar purchase at a convenience store is less than that at a supermarket. Despite…
A:
Q: According to Chemical Engineering magazine, an important property of a fiber is its absorption from…
A: Hello thanks for your question. Since you have posted a question with multiple sub-parts, we will…
Q: Some computer output for an analysis of variance test to compare means is given. Source Groups Error…
A: a) Number of groups in the given study: df for Groups=4 Number of groups-1=4 Number of groups=4+1=5…
Q: Construct the scatterplots for the following bivariate data. 1. Age of a person, in years 11 12 13…
A: 2. Given information: Age Mileage 0.5 16 1 15 1.5 10 2 12 3 10 4 12 4.5 11 5 10…
Q: Consider the following data on marks obtained in Quizzes 1 and 2 by a sample of 10 students enrolled…
A: The following data is given, Quiz 1 Quiz 2 5 20 15 16 12 12 13 10 15 14 14 15 13…
Q: In an experiment to determine whether there is a systematic difference between the weights obtained…
A:
Q: Using the data below, calculate the correlation of these samples. Round your answer to 1 decimal…
A: There are two related samples which are seed_mass and seedling_height. The independent variable is…
Q: Two independent samples are examined and the following are found: n1 = 20, M1 = 30, SS1 = 400, n2 =…
A:
Q: The following are sample data provided by a moving company on the weights of six shipments, the…
A: See the attachment...
Q: what is the critical value at 5% significance level
A: Given that Number of observations, N = 15 Number of brands, k = 3
Q: The following data give the annual salaries (in thousand dollars) of 20 randomly selected health…
A: Solution
Q: A sales manager collected the following data on annual sales for new customer accounts and the…
A: It was stated that a sales manager collected the data on annual sales for new customer accounts and…
Q: Use the data from the Organize the Data section to calculate the following answers. Round your…
A:
Q: Here are the scores on the first exam in an introductory statistics course for 10 students. 83 74…
A: Given data, 83 74 93 85 75 97 93 55 92 81 To find, The quartiles for these first…
Q: The following data summarize the results from an independent-measures study comparing three…
A: (a). Determine whether there are any significant differences among the 3 treatment means There are 3…
Q: Find the first and third quartile for the data shown 5.3 7.6 8.2 10.4 11.7 13 16 27.4 28.3 29.6 Q1 =…
A: Given data: 5.37.68.210.411.7131627.428.329.6
Q: The table below shows the observed pollution indexes of air samples in two areas of a city. Test the…
A: Use Two sample t-test of means . First we will calculate means for both the Areas : Area A Area…
Q: A random sample of 11 professional athletes produced the following data, where r is the number of…
A: We will use R to obtain solution > #enter the data> x=c(5,8,8,7,7,4,5,3,4,8,8)>…
Q: Three types of medium sized cars assembled in New Zealand have been test driven by a motoring…
A:
Q: Below is a list of vertical jumps (in cm) for 24 athletes who compete in various different sports.…
A: A. Using Excel, input the given data in a single column in the spreadsheet. Construct a column for…
Q: Data was collected for a sample of organic snacks. The amount of sugar (in mg) in each snack is…
A: Given that In histogram Frequency is taking on y-axis and amount of sugar taking on x-axis
Q: The following data represent soil water content (percent water by volume) for independent random…
A: The given information is the soil water content for the two independent random samples of soil taken…
Q: The following data represent soil water content (percent water by volume) for independent random…
A: The given information is the soil water content for the two independent random samples of soil taken…

Step by step
Solved in 3 steps with 1 images


- Urban Travel Times Population of cities and driving times are related, as shown in the accompanying table, which shows the 1960 population N, in thousands, for several cities, together with the average time T, in minutes, sent by residents driving to work. City Population N Driving time T Los Angeles 6489 16.8 Pittsburgh 1804 12.6 Washington 1808 14.3 Hutchinson 38 6.1 Nashville 347 10.8 Tallahassee 48 7.3 An analysis of these data, along with data from 17 other cities in the United States and Canada, led to a power model of average driving time as a function of population. a Construct a power model of driving time in minutes as a function of population measured in thousands b Is average driving time in Pittsburgh more or less than would be expected from its population? c If you wish to move to a smaller city to reduce your average driving time to work by 25, how much smaller should the city be?SPSS: In order to compare a new variety of wheat with a standard, an experiment is used with six plots receiving the new variety and ten plots receiving the standard. The yields (t/ha) are as follows: New variety: 2.6 2.1 2.5 2.4 1.9 2.3 Standard variety: 1.7 2.1 2.0 1.8 2.3 1.6 2.0 2.1 2.2 1.9 a) Identify the model for comparing the wheat yield. b) Is there evidence at the 5% significance level that the yield of the new variety is higher? c) Estimate the difference in yield with 95% confidence.Aircraft primer paints are applied to aluminum surfaces to improve paint adhesion. Theprocess engineering group responsible for this operation is interested in learning whetherthree different primers differ in their adhesion properties. An experiment was designed andconducted to investigate the effect of paint primer type on paint adhesion. For each primertype, six specimens were painted, then a finish paint was applied, and the adhesion force wasmeasured. The data from the experiment are shown in the following table.Adhesion force (MPa)Primer Type X 4.5 4.5 4 5 5.5 5Y 5.5 5.5 6 6.5 7 7Z 3.5 4 3 4 5 4.5a) What type of experiment is this? What type of analysis id needed for the investigation?Break down the details and parameters of this experiment design. You must list theparameters that were considered in the design and also mention the quantity of each.b) Does primer type make a significant impact on adhesion, at 5% significance level?
- Professional Golfers’ Earnings Two random samples of earnings of professional golfers were selected. One sample was taken from the Professional Golfers Association, and the other was taken from the Ladies Professional Golfers Association. At α=0.10, is there a difference in the means? The data are in thousands of dollars. Use the critical value method with tables. PGA 446 1147 1344 9188 5687 4910 8553 7573 375 LPGA 48 76 122 466 863 100 1876 2029 4364 2921 (a)State the hypotheses and identify the claim. H0: claim/ do not claim H1: claim/do not claim This hypothesis test one tailed/two tailed a (Choose one) test. (b)Find the critical value. Round the answer to at least two decimal places. Critical value is . Critical value is (c)Compute the test value. Round the standard deviations and F score values to at least two decimal places as needed. F= (d)Make the decision.…A sunscreen company is attempting to improve upon their formula so that it lasts in water longer. They have 4 lead scientists who each came up with a different formulas. In order to see if there is a difference in the time the sunscreen lasts the CEO collects a random sample of each of the four sunscreens the data is shown below. Test the claim that at least one sunscreen has a different lifespan in water at a 0.05 level of significance. Sunscreen A Sunscreen B Sunscreen C Sunscreen D 81 75 52 79 77 34 40 87 64 39 32 72 47 43 61 58 57 47 48 46 80 43 38 63 The hypotheses for this ANOVA test would be: H0:μA=μB=μC=μDH0:μA=μB=μC=μD HA:HA: At least one mean is different. (claim) α=0.05α=0.05 Complete the ANOVA table below: (round answers to 3 decimal places) SS df MS F p-value Between Within The decision of the test is to: reject H0H0 do not reject H0H0 The final conclusion is: There is not enough evidence to reject the claim that…1. An automobile manufacturing company wanted to investigate how the price of one of it's car models depreciates with age. The research department at the company took a sample of 8 cars of this model and collected the following information on the ages (x, in years) and prices (y, in hundreds of pesos) of these cars as shown: Age, x83792546 Price, y18955524140403899 Find the estimated price of a 15 year old car
- A local bus company is planning a new route to serve four housing subdivisions. Random samples of households are taken from each subdivision, and sample members are asked to rate, on a scale of 1 (strongly opposed) to 5 (strongly in favor), their reaction to the proposed service. The results are summarized in the accompanying table. Subdivision 1 Subdivision 2 Subdivision 3 Subdivision 4Ni 240 190 350 280ni 40 40 40 40x̄i 2.5 3.6 3.9 2.8si 0.8 0.9 1.2 0.7a. Find a 90% confidence interval for the mean reaction of households in subdivision 1.b. Using an unbiased estimation procedure, estimate the mean reaction of all households to be served by the new route. c. Find 90% and 95% confidence intervals…A student decides to spin a dime and determine the proportion of times it lands on heads. The student spins the dime 25 times and records that it lands on heads 17 times. Let p = the true proportion of times the dime would land on heads when spun. Under the assumption that the true proportion is 0.5, 100 simulated proportions for samples of size 25 is shown in the dotplot. Using the dotplot, is there evidence that the proportion of times a spun dime lands on heads is greater than 0.5? A) Yes, a proportion of 0.68 proves that the true proportion of heads is greater than 0.5. B) Yes, a proportion of 0.68 only occurred once out of 100 simulated proportions; therefore, there is sufficient evidence that the true proportion of heads is greater than 0.5. C) No, a proportion of 0.68 is only 0.18 more than 0.5; therefore, there is insufficient evidence that the true proportion of heads is greater than 0.5. D) No, a proportion of 0.68 or more occurred 7 times out of 100 simulated…In an effort to link cold environments with hypertension in humans, a preliminary experimentwas conducted to investigate the effect of cold on hypertension in rats. Two random samplesof 6 rats each were exposed to different environments. One sample of rats was held in a normalenvironment at 26°C. The other sample was held in a cold 5°C environment. Blood pressures andheart rates were measured for rats for both groups. The blood pressures for the 12 rats are shownin the accompanying table.a. Do the data provide sufficient evidence that rats exposed to a 5°C environment have ahigher mean blood pressure than rats exposed to a 26°C environment? Use a .05.b. Evaluate the three conditions required for the test used in part (a).
- Have you ever been frustrated because you could not get a container of some sort to release the last bit of its contents? An article reported on an investigation of this issue for various consumer products. Suppose five 6.0 oz tubes of toothpaste of a particular brand are randomly selected and squeezed until no more toothpaste will come out. Then each tube is cut open and the amount remaining is weighed, resulting in the following data: 0.53, 0.64, 0.41, 0.5, 0.35. Does it appear that the true average amount left is less than 10% of the advertised net contents?Calculate the test statistic and determine the P-value. (Round your test statistic to two decimal places and your P-value to three decimal places.)t= P-value =1. A new drug for pain relief is being tested within a given palliative care population. The new drug is being compared to an already approved pain relief drug that is commonly used in providing palliative care to patients who experience chronic severe pain. Assume the patients are asked to rate the pain on a scale from 1 to 10, and the data presented below was obtained from a small study designed to compare the effectiveness of the two drugs. Set up and interpret the results of a Mann-Whitney U test with an alpha of .05.Pain Rating as Reported by PatientsOld Drug 1 3 3 4 6 New Drug 1 2 3 3 7 A) We fail to reject H0, which states the two populations are equal at the alpha equals .05 level because the calculated U value of 10.5 is greater than the critical U value of 2.B) We fail to reject H0, which states the two populations are equal at the alpha equals .05 level because the calculated U value of 14.5 is greater than the critical U value of 2.C) We reject H0 in favor of H1, which…1. A new drug for pain relief is being tested within a given palliative care population. The new drug is being compared to an already approved pain relief drug that is commonly used in providing palliative care to patients who experience chronic severe pain. Assume the patients are asked to rate the pain on a scale from 1 to 10, and the data presented below was obtained from a small study designed to compare the effectiveness of the two drugs. Set up and interpret the results of a Mann-Whitney U test with an alpha of .05.Pain Rating as Reported by PatientsOld Drug 1 2 2 4 6New Drug 1 2 2 3 7Total Sample(Ordered Smallest to Largest)RanksOld Drug New DrugOld Drug New Drug Old Drug New Drug1 1 1 1 1.5 1.52 2 2 2 4.5 4.52 2 2 2 4.5 4.5
