The Color Red and Performance Color affects us in many ways. For example, experiments have shown that the color red appears to enhance men's attraction to women. Previous studies have also shown that athletes competing against an opponent wearing red perform worse, and students exposed to red before a test perform worse. A recent study2 states that "red is hypothesized to impair performance on achievement tasks, because red is associated with the danger of failure." In the study, US college students were asked to solve 15 moderately difficult, five-letter, single-solution anagrams during a 5-minute period. Information about the study was given to participants in either red, green, or black ink just before they were given the anagrams. Participants were randomly assigned to a color group and did not know the purpose of the experiment, and all those coming in contact with the participants were blind to color group. The red group contained 19 participants and they correctly solved an average of 4.4 anagrams. The 27 participants in the green group correctly solved an average of 5.7 anagrams and the 25 participants in the black group correctly solved an average of 5.9 anagrams. Work through the details below to test if performance is different based on prior exposure to different colors. 1"Color Red Increases the Speed and Strength of Reactions," Science Daily, sciencedaily.com, June 2, 2011. 2Elliot, A., et al., "Color and Psychological Functioning: The Effect of Red on Performance Attainment," Journal of Experimental Psychology: General, 2007; 136(1): 154-168. Data approximated from summary statistics. (a) Use the fact that the sum of squares for color groups is 27.7 and the total sum of squares is 84,7 to complete an ANOVA table and find the F-statistic. Round your answers to two decimal places. Source df MS F-Statistic Groups i i Error i i Total i eTextbook and Media (b) Use the F-distribution to find the p-value. Round your answer to three decimal places. p-value = eTextbook and Media (c) What is the conclusion of the test, using a 1 % significance level? O Reject Ho. O Do not reject Ho. eTextbook and Media Is there a significant difference in average number of anagrams solved between the three groups? O Yes O No eTextbook and Media
The Color Red and Performance Color affects us in many ways. For example, experiments have shown that the color red appears to enhance men's attraction to women. Previous studies have also shown that athletes competing against an opponent wearing red perform worse, and students exposed to red before a test perform worse. A recent study2 states that "red is hypothesized to impair performance on achievement tasks, because red is associated with the danger of failure." In the study, US college students were asked to solve 15 moderately difficult, five-letter, single-solution anagrams during a 5-minute period. Information about the study was given to participants in either red, green, or black ink just before they were given the anagrams. Participants were randomly assigned to a color group and did not know the purpose of the experiment, and all those coming in contact with the participants were blind to color group. The red group contained 19 participants and they correctly solved an average of 4.4 anagrams. The 27 participants in the green group correctly solved an average of 5.7 anagrams and the 25 participants in the black group correctly solved an average of 5.9 anagrams. Work through the details below to test if performance is different based on prior exposure to different colors. 1"Color Red Increases the Speed and Strength of Reactions," Science Daily, sciencedaily.com, June 2, 2011. 2Elliot, A., et al., "Color and Psychological Functioning: The Effect of Red on Performance Attainment," Journal of Experimental Psychology: General, 2007; 136(1): 154-168. Data approximated from summary statistics. (a) Use the fact that the sum of squares for color groups is 27.7 and the total sum of squares is 84,7 to complete an ANOVA table and find the F-statistic. Round your answers to two decimal places. Source df MS F-Statistic Groups i i Error i i Total i eTextbook and Media (b) Use the F-distribution to find the p-value. Round your answer to three decimal places. p-value = eTextbook and Media (c) What is the conclusion of the test, using a 1 % significance level? O Reject Ho. O Do not reject Ho. eTextbook and Media Is there a significant difference in average number of anagrams solved between the three groups? O Yes O No eTextbook and Media

Glencoe Algebra 1, Student Edition, 9780079039897, 0079039898, 2018
18th Edition
ISBN:9780079039897
Author:Carter
Publisher:Carter
Chapter10: Statistics
Section10.6: Summarizing Categorical Data
Problem 27PPS

Related questions

Concept explainers
Contingency Table
A contingency table can be defined as the visual representation of the relationship between two or more categorical variables that can be evaluated and registered. It is a categorical version of the scatterplot, which is used to investigate the linear relationship between two variables. A contingency table is indeed a type of frequency distribution table that displays two variables at the same time.
Binomial Distribution
Binomial is an algebraic expression of the sum or the difference of two terms. Before knowing about binomial distribution, we must know about the binomial theorem.
Topic Video
Question
8-1 #9
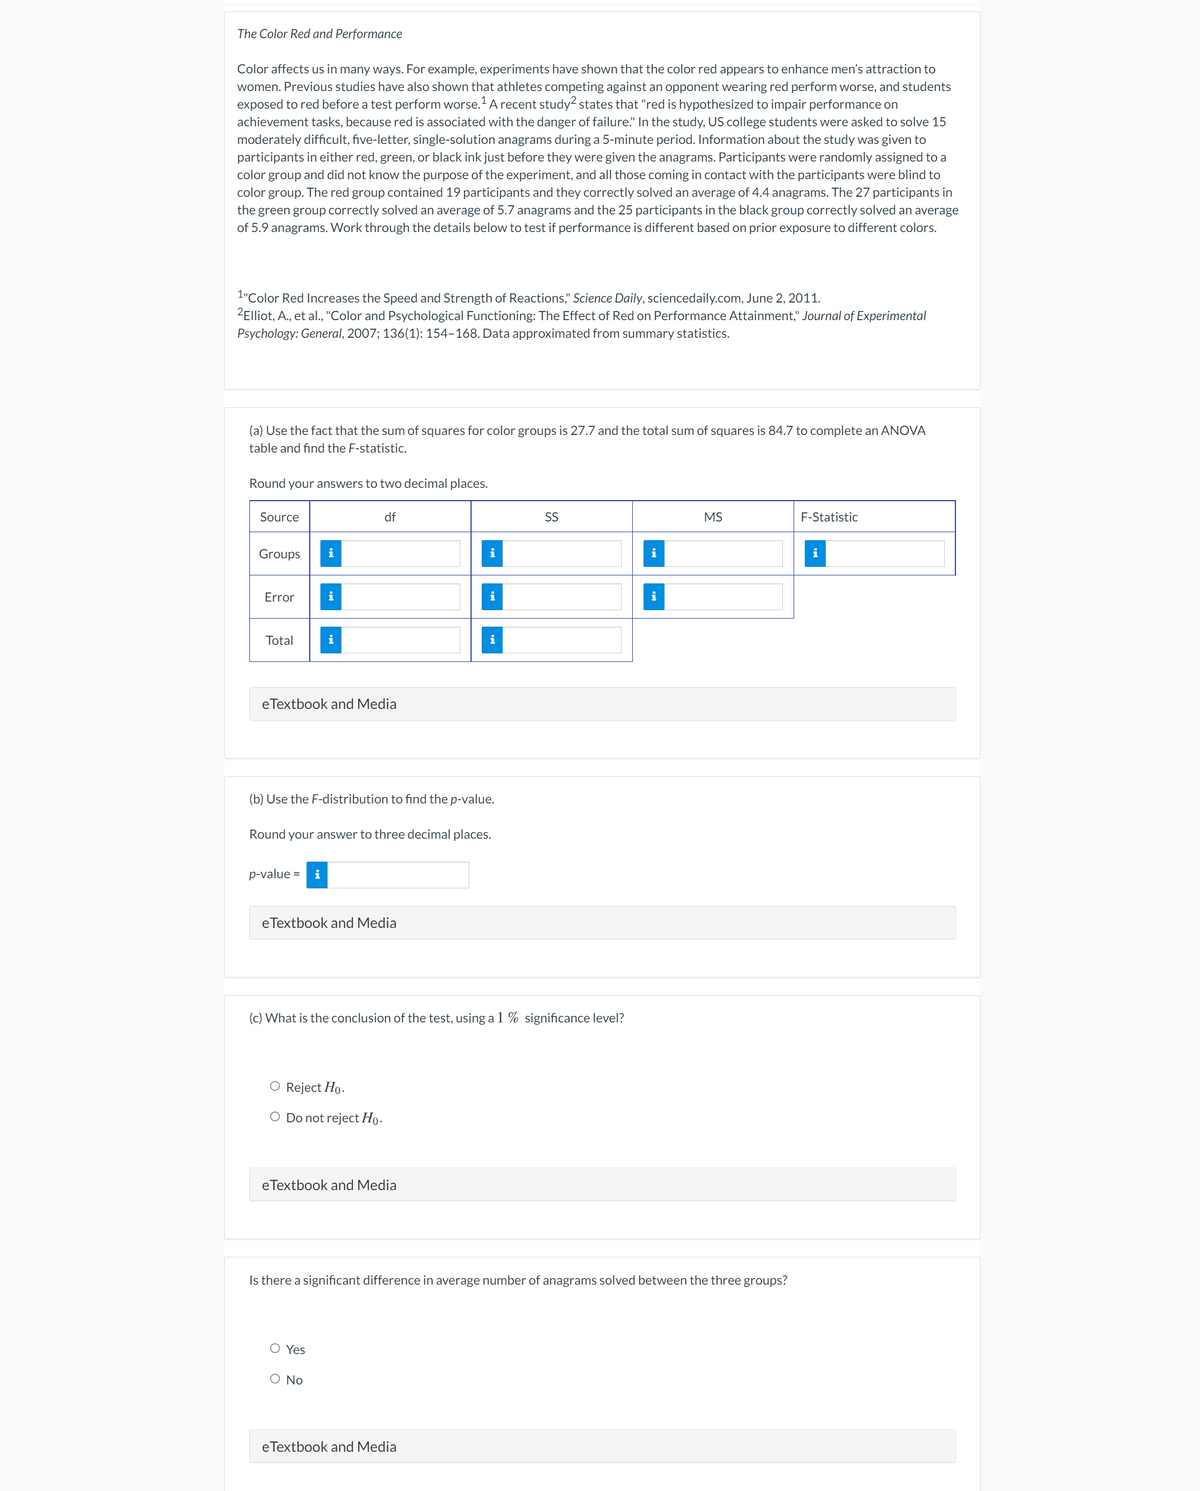
Transcribed Image Text:The Color Red and Performance
Color affects us in many ways. For example, experiments have shown that the color red appears to enhance men's attraction to
women. Previous studies have also shown that athletes competing against an opponent wearing red perform worse, and students
exposed to red before a test perform worse.A recent study? states that "red is hypothesized to impair performance on
achievement tasks, because red is associated with the danger of failure." In the study, US college students were asked to solve 15
moderately difficult, five-letter, single-solution anagrams during a 5-minute period. Information about the study was given to
participants in either red, green, or black ink just before they were given the anagrams. Participants were randomly assigned to a
color group and did not know the purpose of the experiment, and all those coming in contact with the participants were blind to
color group. The red group contained 19 participants and they correctly solved an average of 4.4 anagrams. The 27 participants in
the green group correctly solved an average of 5.7 anagrams and the 25 participants in the black group correctly solved an average
of 5.9 anagrams. Work through the details below to test if performance is different based on prior exposure to different colors.
1"Color Red Increases the Speed and Strength of Reactions," Science Daily, sciencedaily.com, June 2, 2011.
2Elliot, A., et al., "Color and Psychological Functioning: The Effect of Red on Performance Attainment," Journal of Experimental
Psychology: General, 2007; 136(1): 154-168. Data approximated from summary statistics.
(a) Use the fact that the sum of squares for color groups is 27.7 and the total sum of squares is 84.7 to complete an ANOVA
table and find the F-statistic.
Round your answers to two decimal places.
Source
df
SS
MS
F-Statistic
Groups
i
Error
i
Total
i
eTextbook and Media
(b) Use the F-distribution to find the p-value.
Round your answer to three decimal places.
p-value =
i
eTextbook and Media
(c) What is the conclusion of the test, using a 1 % significance level?
O Reject Ho.
O Do not reject Ho.
eTextbook and Media
Is there a significant difference in average number of anagrams solved between the three groups?
O Yes
O No
eTextbook and Media
Expert Solution
This question has been solved!
Explore an expertly crafted, step-by-step solution for a thorough understanding of key concepts.

This is a popular solution!

Trending now
This is a popular solution!

Step by step
Solved in 2 steps

Knowledge Booster


Learn more about
Need a deep-dive on the concept behind this application? Look no further. Learn more about this topic, statistics and related others by exploring similar questions and additional content below.Recommended textbooks for you
Glencoe Algebra 1, Student Edition, 9780079039897…
Algebra
ISBN:
9780079039897
Author:
Carter
Publisher:
McGraw Hill

Holt Mcdougal Larson Pre-algebra: Student Edition…
Algebra
ISBN:
9780547587776
Author:
HOLT MCDOUGAL
Publisher:
HOLT MCDOUGAL

Big Ideas Math A Bridge To Success Algebra 1: Stu…
Algebra
ISBN:
9781680331141
Author:
HOUGHTON MIFFLIN HARCOURT
Publisher:
Houghton Mifflin Harcourt
Glencoe Algebra 1, Student Edition, 9780079039897…
Algebra
ISBN:
9780079039897
Author:
Carter
Publisher:
McGraw Hill
Holt Mcdougal Larson Pre-algebra: Student Edition…
Algebra
ISBN:
9780547587776
Author:
HOLT MCDOUGAL
Publisher:
HOLT MCDOUGAL
Big Ideas Math A Bridge To Success Algebra 1: Stu…
Algebra
ISBN:
9781680331141
Author:
HOUGHTON MIFFLIN HARCOURT
Publisher:
Houghton Mifflin Harcourt