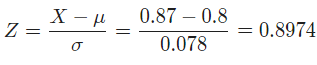
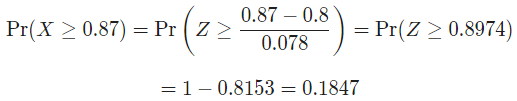
The common fruit fly Drosophila melanogaster is the most studied organism in genetic research because it is small, is easy to grow, and reproduces rapidly. The length of the thorax (where the wings and legs attach) in a population of male fruit flies is approximately Normal with mean 0.800 millimeters (mm) and standard deviation 0.078 mm. (b) What proportion of flies have thorax length greater than 0.87 mm? (Enter your answer as a percentage rounded to two decimal places.) proportion: (c) What proportion of flies have a thorax of length between 0.68 mm and 0.87 mm? (Enter your answer as a percentage rounded to two decimal places.) proportion:


The common fruit fly Drosophila melanogaster is the most studied organism in genetic research because it is small, is easy to grow, and reproduces rapidly. The length of the thorax (where the wings and legs attach) in a population of male fruit flies is approximately Normal with mean 0.800 millimeters (mm) and standard deviation 0.078 mm.
Given Information : The common fruit fly Drosophila melanogaster is the most studied organism in genetic research because it is small, is easy to grow, and reproduces rapidly. The length of the thorax (where the wings and legs attach) in a population of male fruit flies is approximately Normal with mean 0.800 millimeters (mm) and standard deviation 0.078 mm.
Define random variable X denotes length of the thorax (where the wings and legs attach) in a population of male fruit flies .
Here, X ~> N ()

Trending now
This is a popular solution!

Step by step
Solved in 2 steps with 4 images


