The company has within recent years been experiencing increases in revenues from its construction related services such as design, build, expansion and remodeling, and emergency services. It’s main line of business is from the construction of roads and commercial buildings within Jamaica and to a lesser extent a few other Caribbean countries. Since the growth of the tourism sector in the Caribbean, BnB Caribbean has become concerned about the number of other construction companies which have entered the market to provide similar services around the Caribbean region. Business overseas contributes to 40% of the company’s revenues, while the other 60% comes mainly from works done in the domestic market. The COVID-19 pandemic has caused a slowdown in overall operations leading to prolonged delays in delivery of raw materials from abroad. The CEO of the company is optimistic that there will be a turnaround in operations in 2021, and is therefore considering contracting a loan of $500.0 Million from its local bank to help rebuild its lead position in the market and to expand its line of business to include the sales of heavy equipment. The company has over the years relied mainly on issuing long-term bonds to finance its capital projects. As of today, the firm has 50.0 million shares of common stock outstanding. You are hired as the Chief Financial Controller of the company to advise the CEO and board of the company of the current financial health of the company and to assist them in determining whether they would be successful with the new loan. You began by gathering the following financial statements and other data about the firm. (image attached) Required: What are the Financial Performance and Financial Position for- A. Asset Management B. Market Value


The company has within recent years been experiencing increases in revenues from its construction related services such as design, build, expansion and remodeling, and emergency services. It’s main line of business is from the construction of roads and commercial buildings within Jamaica and to a lesser extent a few other Caribbean countries. Since the growth of the tourism sector in the Caribbean, BnB Caribbean has become concerned about the number of other construction companies which have entered the market to provide similar services around the Caribbean region. Business overseas contributes to 40% of the company’s revenues, while the other 60% comes mainly from works done in the domestic market.
The COVID-19 pandemic has caused a slowdown in overall operations leading to prolonged delays in delivery of raw materials from abroad. The CEO of the company is optimistic that there will be a turnaround in operations in 2021, and is therefore considering contracting a loan of $500.0 Million from its local bank to help rebuild its lead position in the market and to expand its line of business to include the sales of heavy equipment. The company has over the years relied mainly on issuing long-term bonds to finance its capital projects. As of today, the firm has 50.0 million shares of common stock outstanding. You are hired as the Chief Financial Controller of the company to advise the CEO and board of the company of the current financial health of the company and to assist them in determining whether they would be successful with the new loan.
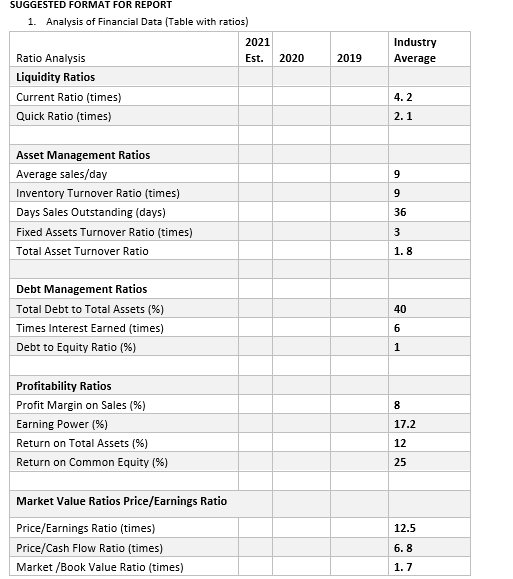
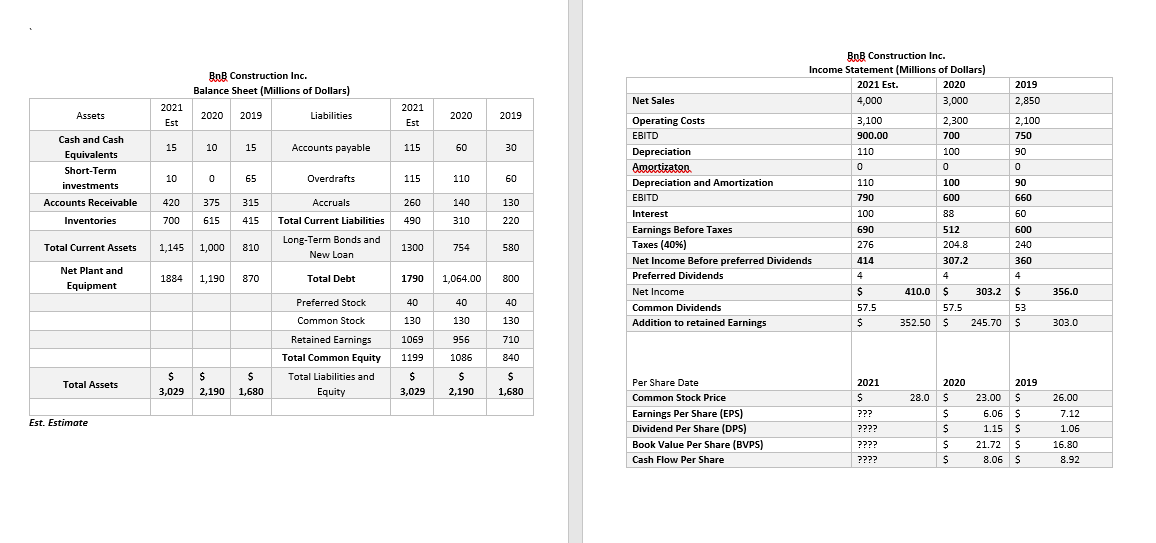
You began by gathering the following financial statements and other data about the firm. (image attached)
Required:
What are the Financial Performance and Financial Position for-
A. Asset Management
B. Market Value

Step by step
Solved in 3 steps with 4 images


