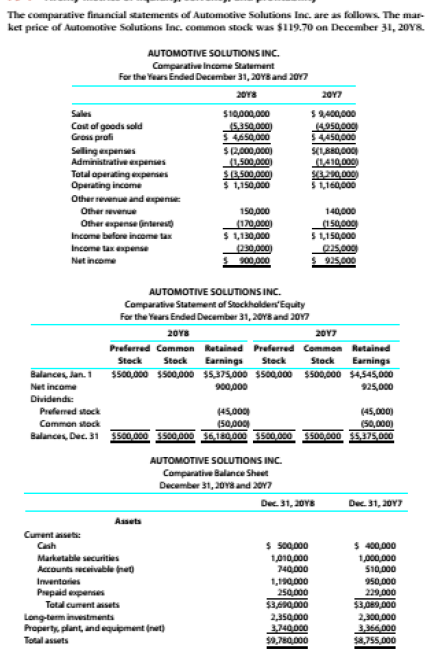
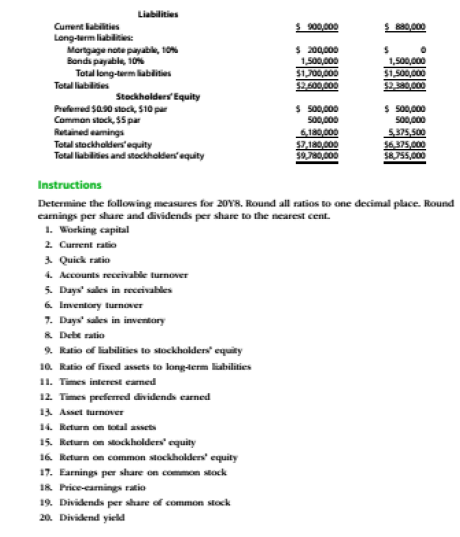
The comparative financial statements of Automotive Solutions Inc. are as follows. The mar- ket price of Automotive Solutions Inc. common stock was $119.70 on December 31, 20Y8. AUTOMOTIVE SOLUTIONS INC. Comparative Income Statement For the Years Ended December 31, 20Y8 and 2017 20Y8 20Y7 $10,000,000 (5350,000) 3 4650,000 Sales Cost of goods sold Grons profi S9400,000 (4950000 $4450,000 Selling expenses Administrative espenses Total operating expenses Operating income S2,000,000) (1.500 000) SE500,000) $ 1,150,000 S1,160,000 Other revenue and expense Other evenue Other espense nterest Income before income tax 140,000 (150,000 S 1,150,000 015,000 925,000 150,000 (170,000) $ 130,000 p30,000) S 900.000 Income tax espense Net income AUTOMOTIVE SOLUTIONS INC. Comparative Statement of Stockhalders'Equity For the Years Ended December 31, 20Y8 and 20Y7 20Y8 20Y7 Preferred Common Retained Preferred Common Retained Stock Stock Earnings Steck Stock Earnings Balances, Jan. 1 $500,000 s500,000 $5,375,000 $5o0.000 $500,000 $4,545,000 900,000 Net income 925,000 Dividends: (45,000) (50,000) $500,000 $5.375,000 Prefered stock (45,000 (50,000 Common stock Balances, Dec. 31 3500.000 3500.000 36,180.000 3500.000 AUTOMOTIVE SOLUTIONS INC. Comparative Balance Sheet December 31, 20Y8 and 2017 Dec. 31, 20v8 Dec. 31, 20Y7 Assets Cument aseti: $ so0.000 $ 400,000 1,000,000 510,000 Cash Marketable securities 1,010,000 740,000 1,190,000 250,000 $3,60.000 2,35000 3740000 $0,780,000 Accounts neceivable net Inventories 950,000 229,000 $3,089,000 2,300,000 3366 000 $8,755,000 Prepaid expenses Total cument ansets Long-term investments Property, plant, and equipment (ret) Total assets Liabilities Cument labilities S 900,000 Long-term liabilities: Mortgage note payable, 10% Bonds payable, 10% Total long-tarm lablities $ 200,000 1,500,000 $1,700,000 2600,000 1,500,000 $1,500,000 $20.000 Total liabiliies Stockholders Equity Prefemed sas0 stock, $10 par Comman stock, 5 par Rutained eamings Total stockholders'equity Tetal liabilies and stockholden'equity $ s00,000 500,000 6.180000 7.180,000 59780,000 S s00,000 500,000 5.375,500 56.375,000 58755,000 Instructions Determine the following measures for 20Y8. Round all ratios to one decimal place. Round camings per share and dividends per share to the nearest cent. 1. Working capital 2. Current ratio 3. Quick ratio 4. Accounts receivable turnover 5. Days' sales in receivables 6. Imventory turnover 7. Days' sales in inventory & Debe ratio 9. Ratio of liabilities to stockholders equity 10. Ratio of fixed assets to long-term liabilities 11. Times interest eamed 12. Times preferred dividends carned 13. Asset turnover 14. Return on total assets 15. Return on stockholders' equity 16. Return on common stockholders' equity 17. Earnings per share on common stock 18 Price-camings ratio 19. Dividends per share of common stock 20. Dividend yield
The comparative financial statements of Automotive Solutions Inc. are as follows. The mar- ket price of Automotive Solutions Inc. common stock was $119.70 on December 31, 20Y8. AUTOMOTIVE SOLUTIONS INC. Comparative Income Statement For the Years Ended December 31, 20Y8 and 2017 20Y8 20Y7 $10,000,000 (5350,000) 3 4650,000 Sales Cost of goods sold Grons profi S9400,000 (4950000 $4450,000 Selling expenses Administrative espenses Total operating expenses Operating income S2,000,000) (1.500 000) SE500,000) $ 1,150,000 S1,160,000 Other revenue and expense Other evenue Other espense nterest Income before income tax 140,000 (150,000 S 1,150,000 015,000 925,000 150,000 (170,000) $ 130,000 p30,000) S 900.000 Income tax espense Net income AUTOMOTIVE SOLUTIONS INC. Comparative Statement of Stockhalders'Equity For the Years Ended December 31, 20Y8 and 20Y7 20Y8 20Y7 Preferred Common Retained Preferred Common Retained Stock Stock Earnings Steck Stock Earnings Balances, Jan. 1 $500,000 s500,000 $5,375,000 $5o0.000 $500,000 $4,545,000 900,000 Net income 925,000 Dividends: (45,000) (50,000) $500,000 $5.375,000 Prefered stock (45,000 (50,000 Common stock Balances, Dec. 31 3500.000 3500.000 36,180.000 3500.000 AUTOMOTIVE SOLUTIONS INC. Comparative Balance Sheet December 31, 20Y8 and 2017 Dec. 31, 20v8 Dec. 31, 20Y7 Assets Cument aseti: $ so0.000 $ 400,000 1,000,000 510,000 Cash Marketable securities 1,010,000 740,000 1,190,000 250,000 $3,60.000 2,35000 3740000 $0,780,000 Accounts neceivable net Inventories 950,000 229,000 $3,089,000 2,300,000 3366 000 $8,755,000 Prepaid expenses Total cument ansets Long-term investments Property, plant, and equipment (ret) Total assets Liabilities Cument labilities S 900,000 Long-term liabilities: Mortgage note payable, 10% Bonds payable, 10% Total long-tarm lablities $ 200,000 1,500,000 $1,700,000 2600,000 1,500,000 $1,500,000 $20.000 Total liabiliies Stockholders Equity Prefemed sas0 stock, $10 par Comman stock, 5 par Rutained eamings Total stockholders'equity Tetal liabilies and stockholden'equity $ s00,000 500,000 6.180000 7.180,000 59780,000 S s00,000 500,000 5.375,500 56.375,000 58755,000 Instructions Determine the following measures for 20Y8. Round all ratios to one decimal place. Round camings per share and dividends per share to the nearest cent. 1. Working capital 2. Current ratio 3. Quick ratio 4. Accounts receivable turnover 5. Days' sales in receivables 6. Imventory turnover 7. Days' sales in inventory & Debe ratio 9. Ratio of liabilities to stockholders equity 10. Ratio of fixed assets to long-term liabilities 11. Times interest eamed 12. Times preferred dividends carned 13. Asset turnover 14. Return on total assets 15. Return on stockholders' equity 16. Return on common stockholders' equity 17. Earnings per share on common stock 18 Price-camings ratio 19. Dividends per share of common stock 20. Dividend yield

Managerial Accounting
15th Edition
ISBN:9781337912020
Author:Carl Warren, Ph.d. Cma William B. Tayler
Publisher:Carl Warren, Ph.d. Cma William B. Tayler
Chapter16: Financial Statement Analysis
Section: Chapter Questions
Problem 4PB

Related questions
Question
| Twenty metrics of liquidity solvency and profitability the comparative financial statements |
Transcribed Image Text:The comparative financial statements of Automotive Solutions Inc. are as follows. The mar-
ket price of Automotive Solutions Inc. common stock was $119.70 on December 31, 20Y8.
AUTOMOTIVE SOLUTIONS INC.
Comparative Income Statement
For the Years Ended December 31, 20Y8 and 2017
20Y8
20Y7
$10,000,000
(5350,000)
3 4650,000
Sales
Cost of goods sold
Grons profi
S9400,000
(4950000
$4450,000
Selling expenses
Administrative espenses
Total operating expenses
Operating income
S2,000,000)
(1.500 000)
SE500,000)
$ 1,150,000
S1,160,000
Other revenue and expense
Other evenue
Other espense nterest
Income before income tax
140,000
(150,000
S 1,150,000
015,000
925,000
150,000
(170,000)
$ 130,000
p30,000)
S 900.000
Income tax espense
Net income
AUTOMOTIVE SOLUTIONS INC.
Comparative Statement of Stockhalders'Equity
For the Years Ended December 31, 20Y8 and 20Y7
20Y8
20Y7
Preferred Common Retained Preferred Common Retained
Stock
Stock Earnings
Steck
Stock
Earnings
Balances, Jan. 1
$500,000 s500,000 $5,375,000 $5o0.000 $500,000 $4,545,000
900,000
Net income
925,000
Dividends:
(45,000)
(50,000)
$500,000 $5.375,000
Prefered stock
(45,000
(50,000
Common stock
Balances, Dec. 31 3500.000 3500.000 36,180.000 3500.000
AUTOMOTIVE SOLUTIONS INC.
Comparative Balance Sheet
December 31, 20Y8 and 2017
Dec. 31, 20v8
Dec. 31, 20Y7
Assets
Cument aseti:
$ so0.000
$ 400,000
1,000,000
510,000
Cash
Marketable securities
1,010,000
740,000
1,190,000
250,000
$3,60.000
2,35000
3740000
$0,780,000
Accounts neceivable net
Inventories
950,000
229,000
$3,089,000
2,300,000
3366 000
$8,755,000
Prepaid expenses
Total cument ansets
Long-term investments
Property, plant, and equipment (ret)
Total assets
Transcribed Image Text:Liabilities
Cument labilities
S 900,000
Long-term liabilities:
Mortgage note payable, 10%
Bonds payable, 10%
Total long-tarm lablities
$ 200,000
1,500,000
$1,700,000
2600,000
1,500,000
$1,500,000
$20.000
Total liabiliies
Stockholders Equity
Prefemed sas0 stock, $10 par
Comman stock, 5 par
Rutained eamings
Total stockholders'equity
Tetal liabilies and stockholden'equity
$ s00,000
500,000
6.180000
7.180,000
59780,000
S s00,000
500,000
5.375,500
56.375,000
58755,000
Instructions
Determine the following measures for 20Y8. Round all ratios to one decimal place. Round
camings per share and dividends per share to the nearest cent.
1. Working capital
2. Current ratio
3. Quick ratio
4. Accounts receivable turnover
5. Days' sales in receivables
6. Imventory turnover
7. Days' sales in inventory
& Debe ratio
9. Ratio of liabilities to stockholders equity
10. Ratio of fixed assets to long-term liabilities
11. Times interest eamed
12. Times preferred dividends carned
13. Asset turnover
14. Return on total assets
15. Return on stockholders' equity
16. Return on common stockholders' equity
17. Earnings per share on common stock
18 Price-camings ratio
19. Dividends per share of common stock
20. Dividend yield
Expert Solution
This question has been solved!
Explore an expertly crafted, step-by-step solution for a thorough understanding of key concepts.

This is a popular solution!

Trending now
This is a popular solution!

Step by step
Solved in 2 steps

Knowledge Booster


Learn more about
Need a deep-dive on the concept behind this application? Look no further. Learn more about this topic, accounting and related others by exploring similar questions and additional content below.Recommended textbooks for you
Managerial Accounting
Accounting
ISBN:
9781337912020
Author:
Carl Warren, Ph.d. Cma William B. Tayler
Publisher:
South-Western College Pub

Financial Accounting
Accounting
ISBN:
9781337272124
Author:
Carl Warren, James M. Reeve, Jonathan Duchac
Publisher:
Cengage Learning

Financial And Managerial Accounting
Accounting
ISBN:
9781337902663
Author:
WARREN, Carl S.
Publisher:
Cengage Learning,
Managerial Accounting
Accounting
ISBN:
9781337912020
Author:
Carl Warren, Ph.d. Cma William B. Tayler
Publisher:
South-Western College Pub
Financial Accounting
Accounting
ISBN:
9781337272124
Author:
Carl Warren, James M. Reeve, Jonathan Duchac
Publisher:
Cengage Learning
Financial And Managerial Accounting
Accounting
ISBN:
9781337902663
Author:
WARREN, Carl S.
Publisher:
Cengage Learning,

Survey of Accounting (Accounting I)
Accounting
ISBN:
9781305961883
Author:
Carl Warren
Publisher:
Cengage Learning

Managerial Accounting: The Cornerstone of Busines…
Accounting
ISBN:
9781337115773
Author:
Maryanne M. Mowen, Don R. Hansen, Dan L. Heitger
Publisher:
Cengage Learning

Financial Accounting: The Impact on Decision Make…
Accounting
ISBN:
9781305654174
Author:
Gary A. Porter, Curtis L. Norton
Publisher:
Cengage Learning