The concentrations of K* in water were measured with atomic absorption spectroscopy (AAS) and atomic emission spectroscopy (AES). Four water samples obtained at different cities were used, and each sample was measured one time. The measurements are shown in the table below: Tulare 8.9 ppm 7.0 ppm What is the calculated t-value (tcalculated) for the statistical comparison of these two methods? AAS AES 1.908 2.664 2.309 2.938 3.012 Fresno 5.5 ppm 5.4 ppm Clovis 6.7 ppm 5.0 ppm Selma 12.5 ppm 9.8 ppm
The concentrations of K* in water were measured with atomic absorption spectroscopy (AAS) and atomic emission spectroscopy (AES). Four water samples obtained at different cities were used, and each sample was measured one time. The measurements are shown in the table below: Tulare 8.9 ppm 7.0 ppm What is the calculated t-value (tcalculated) for the statistical comparison of these two methods? AAS AES 1.908 2.664 2.309 2.938 3.012 Fresno 5.5 ppm 5.4 ppm Clovis 6.7 ppm 5.0 ppm Selma 12.5 ppm 9.8 ppm

Chapter7: Statistical Data Treatment And Evaluation
Section: Chapter Questions
Problem 7.16QAP

Related questions
Question
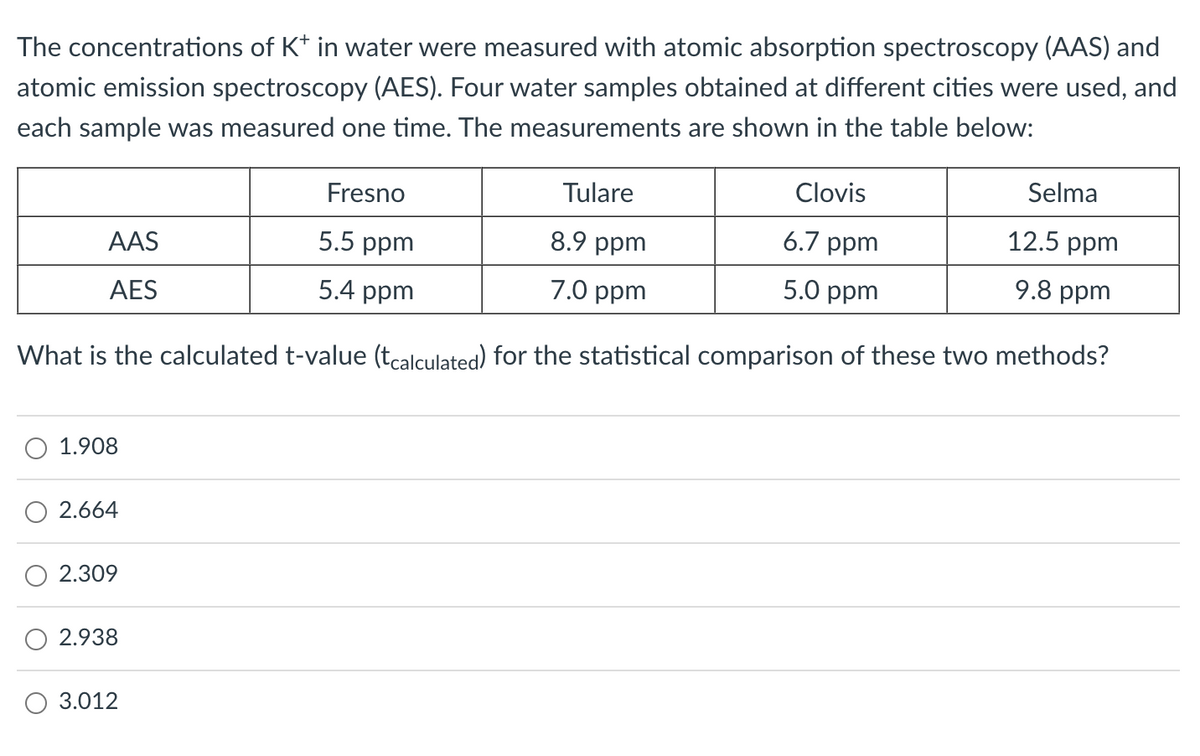
Transcribed Image Text:The concentrations of K* in water were measured with atomic absorption spectroscopy (AAS) and
atomic emission spectroscopy (AES). Four water samples obtained at different cities were used, and
each sample was measured one time. The measurements are shown in the table below:
Tulare
Clovis
8.9 ppm
6.7 ppm
7.0 ppm
5.0 ppm
What is the calculated t-value (tcalculated) for the statistical comparison of these two methods?
AAS
AES
1.908
2.664
2.309
2.938
3.012
Fresno
5.5 ppm
5.4 ppm
Selma
12.5 ppm
9.8 ppm
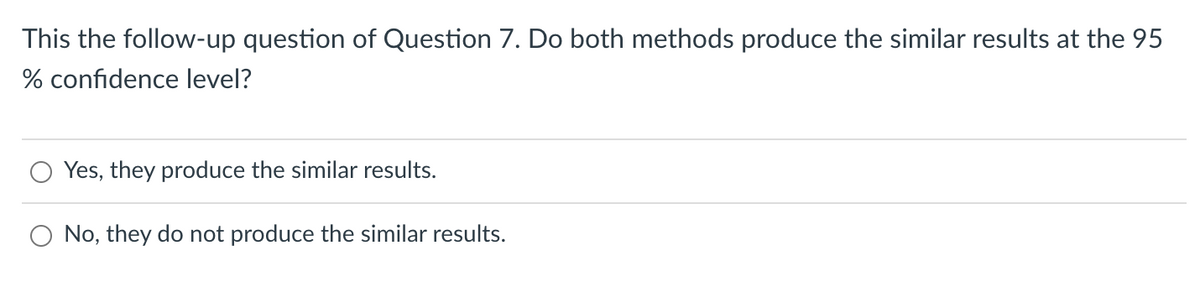
Transcribed Image Text:This the follow-up question of Question 7. Do both methods produce the similar results at the 95
% confidence level?
Yes, they produce the similar results.
No, they do not produce the similar results.
Expert Solution
This question has been solved!
Explore an expertly crafted, step-by-step solution for a thorough understanding of key concepts.

This is a popular solution!

Trending now
This is a popular solution!

Step by step
Solved in 2 steps

Knowledge Booster


Learn more about
Need a deep-dive on the concept behind this application? Look no further. Learn more about this topic, chemistry and related others by exploring similar questions and additional content below.Recommended textbooks for you

Principles of Instrumental Analysis
Chemistry
ISBN:
9781305577213
Author:
Douglas A. Skoog, F. James Holler, Stanley R. Crouch
Publisher:
Cengage Learning
Principles of Instrumental Analysis
Chemistry
ISBN:
9781305577213
Author:
Douglas A. Skoog, F. James Holler, Stanley R. Crouch
Publisher:
Cengage Learning