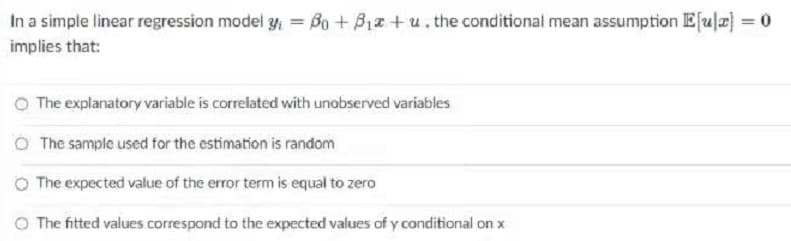
the conditional mean assumption


Q: The mean salary of 5 employees is $42300. The employee salaries have 2 modes: $34500 and $50000. If…
A: The mean salary of 5 employees is $42300 The mean is the sum of all the numbers divide by total…
Q: The independent samples t-test is used when you are looking at the difference in the mean of a…
A: Solution: Independent sample t test: The independent sample t test is a type of parametreic…
Q: A yoga teacher collected data on the ages of the people in her clas The median is 36 years old. The…
A: We have to find correct statement
Q: The mean salary of 5 employees is $42500. The employee salaries have 2 modes: $34500 and $50500. If…
A:
Q: The technicians at a laboratory are analyzing the results of the test that detects a certain…
A:
Q: Determine if one-tailed test or two-tailed test fits the given alternative hypothesis. 4. Male…
A: Solution-: We want to determine if one-tailed test or two-tailed test: (4) Male students of an…
Q: Explain exactly how a paired t-test can be formulated as a one-mean t-test.
A: One mean t-test: Null and alternative hypotheses: The investigator is interested to test whether the…
Q: The mean annual income of workers who are college graduates greater than 120,000.00 a year
A: Given problem Given that The mean annual income of workers who are college graduates greater…
Q: the mean prize of mid sized cars in a region $32000. a test is conducted to see if the claim is…
A: Statistical hypothesis testing implies that no test is ever 100% certain: that’s because we rely on…
Q: Express the altemative hypothesis in symbolic form. A professor claims that the mean amount of time…
A:
Q: The null hypothesis of the statement that mean of the population is 100 units, is:
A: We know that the The null hypothesis is nothing but the claimed statement in the given problem.
Q: Test the claim getting a ticket is independent of the color of your car. Use a significance level of…
A: chi square test on independence
Q: You randomly asked 100 students about their mean exercise time per week. Using the data, you stated…
A: This is an example of inferential analysis .
Q: Which statement is nota definition of the sample mean? a) The average value of the observed values…
A: We have given the statement of the sample mean:
Q: Attached is data for a study conducted to determine whether students of certain income brackets…
A: Introduction: It is of interest to test whether the income brackets of the students, and their…
Q: Give information about the subjective expected utility theory ( 800 words)
A: Subjective expected utility is defined as the desirability of an economic opportunity as seen by a…
Q: Determine whether the statement is true or false. If it is false, rewrite it as a true statement. As…
A:
Q: Which measure of the central tendency can be used for both numerical and categorical variables a.…
A: Arithmetic mean and median can be used only for numerical variable as in the calculations of…
Q: The mean price of mid-sized cars in a region is $32,000. A test is conducted to see if the claim is…
A:
Q: Suppose you are interested in testing whether the mean earning of men is representative of the…
A:
Q: The expected value (mean) of a binomial variable is 15. The number of trials is 20. The probability…
A: Given that this is binomial variable We know mean of binomial distribution E(x) = n*p ......(1) P is…
Q: elow are sample research questions. Identify which T-test (Independent or Dependent) are you going…
A: Dependent T-test is used to compare the means of two related or dependent group. Independent T-test…
Q: State the final conclusion that addresses the original claim. ▼(reject/ fail to reject) H0.…
A: Given, n=10α=0.05 The mean and standard deviation of the data is obtained as-…
Q: Two-tailed test, a0.02
A: Given that level of significance (α) = 0.20 Two-tailed test
Q: What does the ∩ mean
A: The Solution is given below:
Q: Children in the United States account directly for $36 billion in sales annually. When their…
A: Thank you for posting this question! Since it contains multiple sub-parts, I will solve the first…
Q: determine the mean
A: The following is the formulae to calculate the mean for any type of data set (or observations) Mean…
Q: For each claim, express the original claim in symbolic form. Then identify the null and alternative…
A: (a) let p be the proportion of households impaired by crime . then , we can test H0:p=0.15…
Q: You are a teacher. Your first-period class, with 23 students, had a mean score score of 85% on the…
A:
Q: According to a report, the mean of monthly cell phone bills was $48.33 in 2017. A researcher…
A: State the null and alternate hypothesis. The null hypothesis states that the mean of monthly cell…
Q: A researcher watches popular television shows and records every time someone interrupts a speaker.…
A: The researcher records the frequency of interruption on television shows. This frequency represents…
Q: e integers or decimals. Do not round.) hat would it mean to make a Type I error? roker V the…
A:
Q: The mean is not one of the most commonly used measures of central tendency. Select one: False True
A: The mean is not one of the most commonly used measures of central tendency. Select one: False True
Q: Claim: Fewer than 9292% of adults have a cell phone. In a reputable poll of 10151015 adults,…
A: Here, n=1015, p=0.82, and .
Q: 6) The mean salary of 5 employees is $41800. The employee salaries have 2 modes: $33000 and $51500.…
A:
Q: A researcher conducts a study comparing anxiety levels in teens based on their social media usage.…
A: Given information: The data represents the descriptive and inferential statistics of anxiety scores…
Q: Why do you need differentiability to apply the Mean Value Theorem? Find a counterexample.
A: Consider the function f(x)=2x0≤x≤28-2x2<x≤4 in the interval [0,4].…
Q: In hypothesis testing, if we have the alternate hypothesis that the mean is less than 5, this leads…
A: Given : In testing of hypothesis Alternative hypo. that the mean is less than 5 Let μ : Mean Ha :…
Q: Which of the following statements about geometric mean return is are true: I. Geometric mean return…
A: Geometric mean return: Geometric mean return is the average rate of the return for some investment…
Q: Express the alternative hypothesis in symbolic form. A professor claims that the mean amount oftime…
A: According to the provided information, A professor claims that the mean amount of time (in hours)…
Q: Basic Computation: Probability as Relative Frequency A recent Haris Poll survey of 1010 U.S. adults…
A: Since you have asked multiple questions, we will solve the first question for you. If you want any…
Q: Prove or disprove :Arithmetic Mean is greater than Geometric Mean and Geometric Mean is greater than…
A: Prove tha Am>Gm>HM
Q: Find: Test statistic P-value Conclusion
A: b. The test statistic is, χ2=n-1s2σ2=46-112.72102=7258.05100=72.5805 Thus, the test statistic is…
Q: 5. Use the data in Item 3. What does the conditional frequency 18 represent 40 this context? A the…
A: given that the 2 way frequency table. we need to find what does the conditional frequency (18/40)…
Q: Statistical Process control is the measurement of rejects in the final product. O a. True O b. False
A: Statistical Process Control is the measurement of rejects in the final product Definition:…
Q: The mean age of six persons is 50 years. The ages of five of these six persons are 51, 33, 46, 49,…
A: Let X denote the age of the person, then it is given that the mean of n = 6 persons is x¯ = 50…
Q: tify the test statistic. Identify the P-value. State the final conclusion that addresses
A: Correct option: The null and alternative hypothesis is:
Q: Prove that geometric mean is less or equal to arithmetic mean but is greater than harmonic mean by…
A: Measure of central tendency measures the central or average value of a dataset. Measured of…
Q: a. What is the arithmetic mean of the Alaska unemployment rates? b. Find the median and the mode for…
A: 21. The unemployment rate in the state of alaska by month is given in the table below : Jan Feb…
14

Step by step
Solved in 2 steps

- In a typical multiple linear regression model where x1 and x2 are non-random regressors, the expected value of the response variable y given x1 and x2 is denoted by E(y | 2,, X2). Build a multiple linear regression model for E (y | *,, *2) such that the value of E(y | x1, X2) may change as the value of x2 changes but the change in the value of E(y | X1, X2) may differ in the value of x1 . How can such a potential difference be tested and estimated statistically?The results for the regression are as follows Coefficients Standard Error T stat Intercept 14.63 0.5226 27.995 financial crisis 13.71 1.0610 12.922 COVID-19 crisis 15.71 1.6643 9.439 transition 5.40 1.1835 4.563 In estimating the regression, you are also concerned that the t-statistics may be inflated because of the presence of conditional heteroscedasticity. You conduct a regression of the squared residuals against the dummy variables X1, X2, and X3 and find that for the squared residuals regression: Multiple R 0.4145 R Square 0.1718 Adjusted R Square 0.1600 SEE 92.3760 Conduct a test at the level to see if conditional heteroskedasticity is present In view of your answer for a), what needs to be done?A researcher would like to predict the dependent variable YY from the two independent variables X1X1 and X2X2for a sample of N=20N=20 subjects. Use multiple linear regression to calculate the coefficient of multiple determination and test the significance of the overall regression model. Use a significance level α=0.02. X1X1 X2X2 YY 31.4 32.3 25.2 85.4 28.1 53 66.3 42.6 67.4 59 56.1 70.7 52.4 40.4 39.7 86.4 23.7 35 50.9 36.7 34.4 74.4 38 64.9 57.3 47.6 67.4 61.9 33.3 41.3 48.6 49.7 53.6 46.6 47.2 34.5 31.8 38.7 40.9 86 55 74 69.8 27.7 45.9 65.8 48.2 42.4 44.7 55.3 55.1 57.3 27 31.5 60.4 28.1 19.4 65.9 26 13.7 SSreg= SSres= R2= F= P-value = What is your decision for the hypothesis test? Reject the null hypothesis, H0:β1=β2=0 Fail to reject H0H0 What is your final conclusion? The evidence supports the claim that one or more of the regression coefficients is non-zero The evidence supports the claim that all of the regression…
- 1. In the study of linear regression analysis, distinguish between the following expressions:(a) regressand and regressor(b) predicand and predictor(c) simple and multiple regression models2. Consider the following table: X322366374386 Y25159286560308035328570 (a) Fit the regression model (b) Determine the coefficient of determination and interpret it.(c) Test the hypothesis : versus at 5% level of significance.(d) Find the 90 % confidence interval of the expected mean prediction for x = 6. CAT 21. Use the table below:X115202530354045485060 X2100110115120140142144146150160 Y1232334556 (i) Fit a regression equation to the multiple regression model by least squares method.(ii) Predict Y when X1=3.5 and X2=5.5(iii) Compute TSS, ESS and RSS.(iv) Test for the significance of overall regression at 5% level of significance. 2. (a) The following is a two-parameter gamma density function: where . Determine expressions in terms of and for (i) E[X] (ii) Var(X)(b) Research conducted on the…2(a).SSR in linear regression is equal to? SST-SSE SST+SSE SSE-SST SST x SSE SST/SSE correct option? (b).SSE or Sum of square erros show variations in between the populations variations within the populatios Type 1 error Family wise wrror Type 2 error variations within the samples correct option?A researcher would like to predict the dependent variable YY from the two independent variables X1X1 and X2X2 for a sample of N=20N=20 subjects. Use multiple linear regression to calculate the coefficient of multiple determination and test the significance of the overall regression model. Use a significance level α=0.05α=0.05. X1X1 X2X2 YY 65.4 65.8 57.3 72.8 70.8 55.1 63.3 59.9 66.9 59.1 60.4 60.4 65.4 66.9 56.2 58.3 61.9 50.4 57.1 57.1 54.2 78.2 62.5 67.5 54.2 55.9 57.1 56.5 55.5 57.8 57.9 56.2 60.8 54.3 54.8 61.8 68.2 70.5 71.8 60 64.1 58.8 66.6 60.5 54.6 66.7 68.5 51.7 45.1 48.6 57.1 58.4 59.9 55.9 58.6 66.3 52.5 56 60.5 67.1 SSreg=SSres=R2=F=P-value =
- A sixth-grade teacher believes that there is a relationship between his students’ IQscores (y) and the numbers of hours (x) they spend watching television each week. Thefollowing table shows a random sample of 7 sixth-grade students.y 125 116 97 114 85 107 105x 5 10 30 16 41 28 21 Does the data provide sufficient evidence to indicate that the simple linear regressionmodel is appropriate to describe the relationship between x and y? Perform a model utilitytest at α = 0.05. (Give H0, Ha, rejection region, observed test statistic, P-value, decisionand conclusion.)Find the Pearson sample correlation coefficient between x and y. Then interpretthe result.A random sample of twelve students were chosen, and their midterm test score (y), as- signment score (x1), and missed classes (x2) were recorded as follows: Midterm Score, y Assignment Score, x1 Classes Missed, x2 85 74 76 90 85 87 94 98 81 91 76 74 65 50 55 65 55 70 65 70 55 70 50 55 5 7 5 2 6 3 2 5 4 3 1 4 (i) What is the fitted multiple linear regression equation of the form yˆ = b0 + b1x1 + b2x2? (ii) From part (i) above, estimate the midterm test score grade for a student who has an assignment score of 60 and missed 4 classes.A researcher would like to predict the dependent variable YY from the two independent variables X1X1 and X2X2 for a sample of N=11N=11 subjects. Use multiple linear regression to calculate the coefficient of multiple determination and test statistics to assess the significance of the regression model and partial slopes. Use a significance level α=0.05α=0.05. X1X1 X2X2 YY 52.3 45.6 49.1 55.9 48.7 53.1 46.5 47.4 45.9 52 45.6 59.8 48.9 45.5 52.6 46.2 35.1 71.2 28.8 32.6 33.5 40.7 41 40.3 43.7 40 65.8 47 37.8 52.8 34.2 28 53.5 R2=R2= (Not the adjusted R2R2) FF test statistic = P-value for overall model = test statistic for b1b1 p-value for the two-tailed test = test statistic for b2b2 p-value for the two-tailed test = What is your conclusion for the overall regression model at the 0.05 alpha level (also called the omnibus test)? The overall regression model is statistically significant at α=0.05α=0.05. The overall…
- (b)A random sample of twelve students were chosen, and their midterm test score ( y), assignment score (x1), and missed classes (x2) were recorded as follows: Midterm Score, y Assignment Score, x1 Classes Missed, x2 85 65 1 + Ω 74 50 7 76 55 5 90 65 2 85 55 6 87 70 3 94 65 2 98 70 5 81 55 4 91 70 3 76 50 1 74 55 4 (i)What is the fitted multiple linear regression equation of the form ˆy = b0 + b1x1 + b2x2? (ii)From part 6(b)(i) above, estimate the midterm test score grade for a student who has an assignment score of 60 and missed 4 classes. (iii)Assume that the data on ( y, x1, x2) above in 6(b) is inputted into SPSS, with the following results: ANOVA Source SS df MS F…(b)A random sample of twelve students were chosen, and their midterm test score ( y), assignment score (x1), and missed classes (x2) were recorded as follows: Midterm Score, y Assignment Score, x1 Classes Missed, x2 85 65 1 + Ω 74 50 7 76 55 5 90 65 2 85 55 6 87 70 3 94 65 2 98 70 5 81 55 4 91 70 3 76 50 1 74 55 4 (i)What is the fitted multiple linear regression equation of the form ˆy = b0 + b1x1 + b2x2? (ii)From part 6(b)(i) above, estimate the midterm test score grade for a student who has an assignment score of 60 and missed 4 classes. (iii)Assume that the data on ( y, x1, x2) above in 6(b) is inputted into SPSS, with the following results: ANOVA Source SS df MS F…(b)A random sample of twelve students were chosen, and their midterm test score ( y), assignment score (x1), and missed classes (x2) were recorded as follows: Midterm Score, y Assignment Score, x1 Classes Missed, x2 85 65 8 74 50 7 76 55 5 90 65 2 85 55 6 87 70 3 94 65 2 98 70 5 81 55 4 91 70 3 76 50 1 74 55 4 (i)What is the fitted multiple linear regression equation of the form ˆy = b0 + b1x1 + b2x2? (ii)From part 6(b)(i) above, estimate the midterm test score grade for a student who has an assignment score of 60 and missed 4 classes. (iii)Assume that the data on ( y, x1, x2) above in 6(b) is inputted into SPSS, with the following results: ANOVA Source SS df MS F…