
MATLAB: An Introduction with Applications
6th Edition
ISBN: 9781119256830
Author: Amos Gilat
Publisher: John Wiley & Sons Inc
expand_more
expand_more
format_list_bulleted
Related questions
Question
State the final conclusion that addresses the original claim.
▼(reject/ fail to reject)
H0.
There is
▼ ( not sufficeint or sufficient )
▼
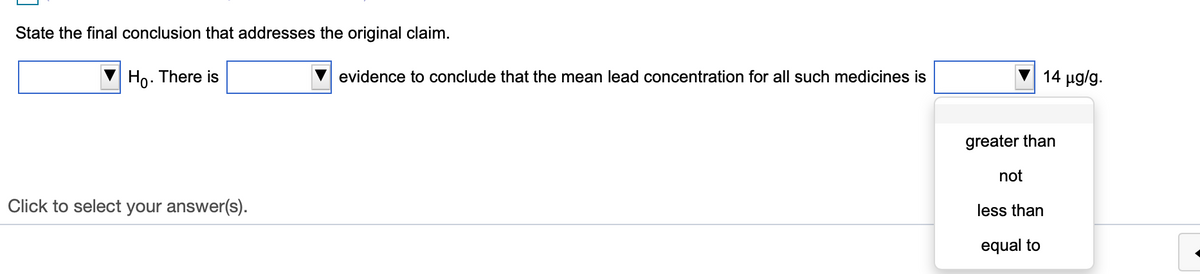

Transcribed Image Text:State the final conclusion that addresses the original claim.
Ho. There is
evidence to conclude that the mean lead concentration for all such medicines is
14 µg/g.
greater than
not
Click to select your answer(s).
less than
equal to

Transcribed Image Text:Listed below are the lead concentrations in ug/g measured in different traditional medicines. Use a 0.05 significance level to test the claim that the mean lead
concentration for all such medicines is less than 14 ug/g. Assume that the sample is a simple random sample.
7
10
10.5
14
22
12
3 O
Assuming all conditions for conducting a hypothesis test are met, what are the null and alternative hypotheses?
Ο Α. Ho: μ= 14 μg/g
H1: µ<14 µg/g
B. Ho: µ> 14 µg/g
H1:µ<14 µg/g
O C. H: μ= 14 μg/g
H1: µ# 14 µg/g
Ο D. Ho: μ= 14 μg/g
H:µ > 14 µg/g
Determine the test statistic.
(Round to two decimal places as needed.)
Determine the P-value.
(Round to three decimal places as needed.)
State the final conclusion that addresses the original claim.
Ho. There is
evidence to conclude that the mean lead concentration for all such medicines is
14 ug/g.
Expert Solution
This question has been solved!
Explore an expertly crafted, step-by-step solution for a thorough understanding of key concepts.

This is a popular solution

Trending nowThis is a popular solution!

Step by stepSolved in 2 steps with 1 images

Knowledge Booster


Learn more about
Need a deep-dive on the concept behind this application? Look no further. Learn more about this topic, statistics and related others by exploring similar questions and additional content below.Similar questions
- 0.05 level of significance. Solve for appropriate test statistic and show written work!arrow_forwardThe standard deviation of a population A. Is the average of the squared deviations between each of the data points and the mean B. Is the average distance from each of the data points to the population's mean C. Is impossible to calculate D. Is only for statisticians E. All of the above F. None of the abovearrow_forwardMake reference to the table below to answer the question that follows: Summary of number of times the child has been placed previously Mean Std. Dev. Freq. physically attacked people never sometimes often Total Source Between groups Within groups 5.5803571 5.9557503 8.7636364 8.7938607 9.8571429 7.8631146 Total 6.9893617 7.2826725 L₂² Analysis of Variance SS df MS 112 55 21 188 F 568.203236 2 284.101618 9349.77549 185 50.539327 9917.97872 187 53.0373194 Bartlett's test for equal variances: chi2(2) = 12.1506 Prob-chi2= 0.002 5.62 Prob > F Does this test violate the assumption of equal variances? 0.0043 O Yes, we are in violation of the assumption of equal variances because p= .002 for Bartlett's test O Yes, we are in violation of the assumption of equal variances because p= .0043 for the difference of means test O No, we are not in violation of the assumption of equal variances because .0043 for the difference of means test No, we are not in violation of the assumption of equal…arrow_forward
- To test whether the mean time needed to mix a batch of material is the same for machines produced by three manufacturers, the Jacobs Chemical Company obtained the following data on the time (in minutes) needed to mix the material. 3 1 19 21 25 20 23 24 21 23 a. Use these data to test whether the population mean times for mixing a batch of material differ for the three manufacturers. Use a 0.05. Compute the values below (to 2 decimals, if necessary). Sum of Squares, Treatment Sum of Squares, Error Mean Squares, Treatment Mean Squares, Error Calculate the value of the test statistic (to 2 decimals). Manufacturer What conclusion can you draw after carrying out this test?. Select your answer- 2 29 27 32 28 The p-value is -Select your answer What is your conclusion? -Select your answer- b. At the a 0.05 level of significance, use Fisher's LSD procedure to test for the equality of the means for manufacturers 1 and 3. Calculate Fisher's LSD Value (to 2 decimals).arrow_forwardPlease show workarrow_forward1. Suppose we wish to test Ho: µ = 47 versus Ha: µ > 47. What will result if we conclude that the mean is greater than 47 when its true value is really 52? a. We have made a Type II error. b. We have made a Type I error. c. We have made a correct decision. d. None of the choices is correct. 2. A scientist would like to test if a certain vaccine’s side effect is increased heart rate. To test this claim, a random sample of 35 human subjects were tested and it was found out that their average resting heart rate is 87 beats per minute (bpm). Studies suggest that the average resting heart rate of a normal adult is around 80 beats per minute (bpm) with a standard deviation of 20 beats per minute (bpm). Which of the conclusion is supported by the data at 0.01 level of significance? a. The vaccine does not significantly increase the average resting heart rate. b. There is no sufficient evidence to say that the vaccine significantly increase the average resting heart rate. c. The vaccine…arrow_forward
- 7. A population has a mean of u = 60 and a standard deviation of o = 12. a. For this population, find the z-score for each of the following X values. X = 69 X = 84 X = 63 X = 54 X = 48 X = 45arrow_forwardA particular paper included the accompanying data on the tar level of cigarettes smoked for a sample of male smokers who subsequently died of lung cancer. Assume it is reasonable to regard the sample as representative of male smokers who die of lung cancer. Is there convincing evidence that the proportion of male smoker lung cancer deaths is not the same for the four given tar level categories at the ? = .05 level? (Use 2 decimal places.) Tar Level Frequency 0-7 129 8-14 324 15-21 543 22 153 ?2 = P-value interval p < 0.0010.001 ≤ p < 0.01 0.01 ≤ p < 0.05 0.05 ≤ p < 0.10 p ≥ 0.10arrow_forwardIn addition, provide the (estimated) standard error of the estimator that you use in 1a.arrow_forward
arrow_back_ios
arrow_forward_ios
Recommended textbooks for you
- MATLAB: An Introduction with ApplicationsStatisticsISBN:9781119256830Author:Amos GilatPublisher:John Wiley & Sons Inc
 Probability and Statistics for Engineering and th...StatisticsISBN:9781305251809Author:Jay L. DevorePublisher:Cengage Learning
 Statistics for The Behavioral Sciences (MindTap C...StatisticsISBN:9781305504912Author:Frederick J Gravetter, Larry B. WallnauPublisher:Cengage Learning
  Elementary Statistics: Picturing the World (7th E...StatisticsISBN:9780134683416Author:Ron Larson, Betsy FarberPublisher:PEARSON
 The Basic Practice of StatisticsStatisticsISBN:9781319042578Author:David S. Moore, William I. Notz, Michael A. FlignerPublisher:W. H. Freeman
 Introduction to the Practice of StatisticsStatisticsISBN:9781319013387Author:David S. Moore, George P. McCabe, Bruce A. CraigPublisher:W. H. Freeman
MATLAB: An Introduction with Applications
Statistics
ISBN:9781119256830
Author:Amos Gilat
Publisher:John Wiley & Sons Inc
Probability and Statistics for Engineering and th...
Statistics
ISBN:9781305251809
Author:Jay L. Devore
Publisher:Cengage Learning
Statistics for The Behavioral Sciences (MindTap C...
Statistics
ISBN:9781305504912
Author:Frederick J Gravetter, Larry B. Wallnau
Publisher:Cengage Learning
Elementary Statistics: Picturing the World (7th E...
Statistics
ISBN:9780134683416
Author:Ron Larson, Betsy Farber
Publisher:PEARSON
The Basic Practice of Statistics
Statistics
ISBN:9781319042578
Author:David S. Moore, William I. Notz, Michael A. Fligner
Publisher:W. H. Freeman
Introduction to the Practice of Statistics
Statistics
ISBN:9781319013387
Author:David S. Moore, George P. McCabe, Bruce A. Craig
Publisher:W. H. Freeman