The contingency table below shows the results of a survey of video viewing habits by age. Video Viewing Platform Preferred Viewer Age Mobile/Laptop Device TV Screen Row Tota1 64 18-34 31 33 35-54 9. 18 55+ 12 18 Column Total 46 54 100 Find the following probabilities or percentages: (a) Probability that a viewer is aged 18-34. (Round your answer to 2 decimal places.) Probability (b) Probability that a viewer prefers watching videos on a TV screen. (Round your answer to 2 decimal places.) Probability (c) Percentage of viewers who 18-34 and prefer videds on a mobile or laptop device. Percentage of viewers |% (d) Percentage of viewers given they are 18-34 who prefer videos on a mobile or laptop device. (Round your answer to 2 dec places.) Percentage of viewers |% (e) Percentage of viewers who are 35-54 or prefer videos on a mobile or laptop device.
The contingency table below shows the results of a survey of video viewing habits by age. Video Viewing Platform Preferred Viewer Age Mobile/Laptop Device TV Screen Row Tota1 64 18-34 31 33 35-54 9. 18 55+ 12 18 Column Total 46 54 100 Find the following probabilities or percentages: (a) Probability that a viewer is aged 18-34. (Round your answer to 2 decimal places.) Probability (b) Probability that a viewer prefers watching videos on a TV screen. (Round your answer to 2 decimal places.) Probability (c) Percentage of viewers who 18-34 and prefer videds on a mobile or laptop device. Percentage of viewers |% (d) Percentage of viewers given they are 18-34 who prefer videos on a mobile or laptop device. (Round your answer to 2 dec places.) Percentage of viewers |% (e) Percentage of viewers who are 35-54 or prefer videos on a mobile or laptop device.

College Algebra
7th Edition
ISBN:9781305115545
Author:James Stewart, Lothar Redlin, Saleem Watson
Publisher:James Stewart, Lothar Redlin, Saleem Watson
Chapter9: Counting And Probability
Section9.3: Binomial Probability
Problem 33E: Sick leave probability that a given worker at Dyno Nutrition Will call in sick on a Monday is 004....

Related questions

Concept explainers
Contingency Table
A contingency table can be defined as the visual representation of the relationship between two or more categorical variables that can be evaluated and registered. It is a categorical version of the scatterplot, which is used to investigate the linear relationship between two variables. A contingency table is indeed a type of frequency distribution table that displays two variables at the same time.
Binomial Distribution
Binomial is an algebraic expression of the sum or the difference of two terms. Before knowing about binomial distribution, we must know about the binomial theorem.
Topic Video
Question
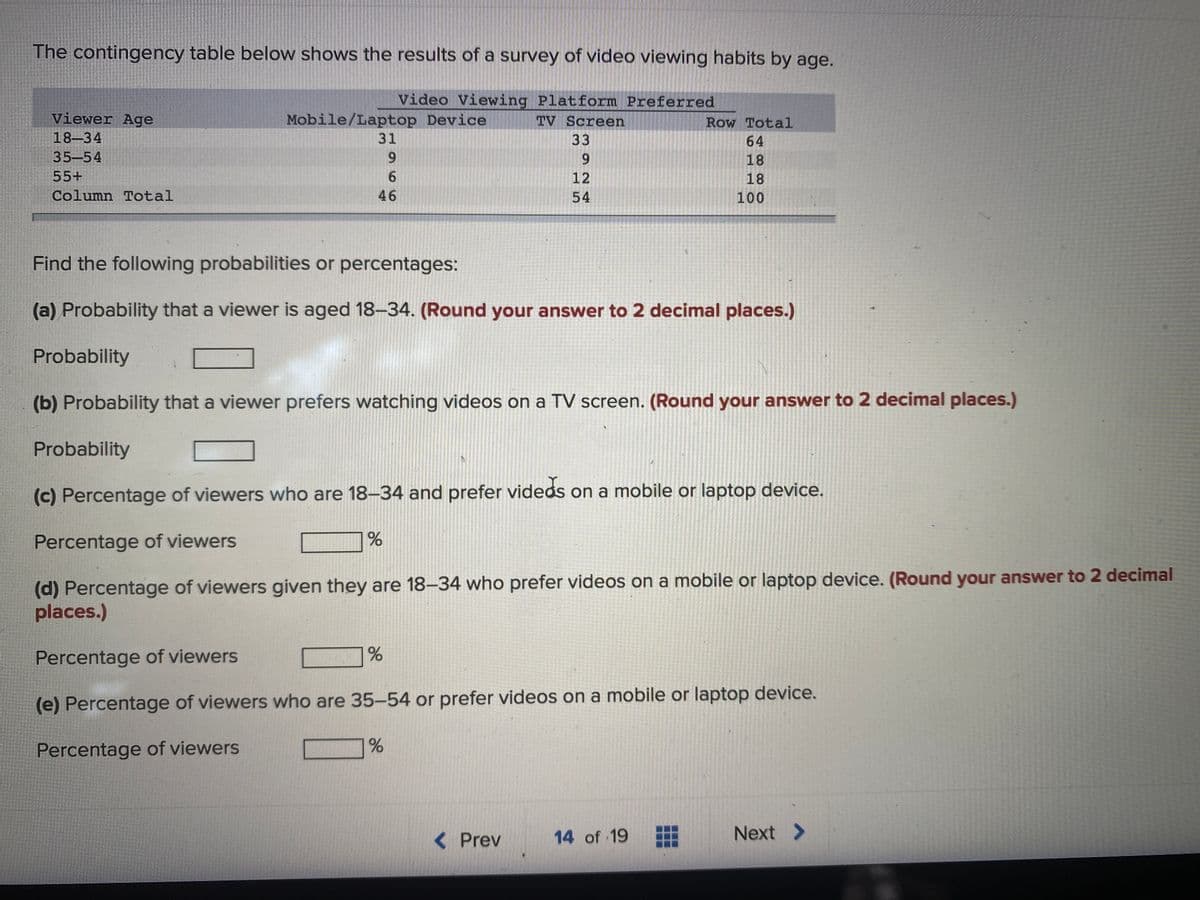
Transcribed Image Text:The contingency table below shows the results of a survey of video viewing habits by age.
Video Viewing Platform Preferred
Viewer Age
Mobile/Laptop Device
TV Screen
Row Total
18-34
31
33
64
35-54
9.
9.
18
55+
6.
12
18
Column Total
46
54
100
Find the following probabilities or percentages:
(a) Probability that a viewer is aged 18–34. (Round your answer to 2 decimal places.)
Probability
(b) Probability that a viewer prefers watching videos on a TV screen. (Round your answer to 2 decimal places.)
Probability
(c) Percentage of viewers who are 18–34 and prefer videds on a mobile or laptop device.
Percentage of viewers
(d) Percentage of viewers given they are 18–34 who prefer videos on a mobile or laptop device. (Round your answer to 2 decimal
places.)
Percentage of viewers
(e) Percentage of viewers who are 35-54 or prefer videos on a mobile or laptop device.
Percentage of viewers
< Prev
14 of 19
Next >
Expert Solution
This question has been solved!
Explore an expertly crafted, step-by-step solution for a thorough understanding of key concepts.

Step by step
Solved in 4 steps with 4 images

Knowledge Booster


Learn more about
Need a deep-dive on the concept behind this application? Look no further. Learn more about this topic, probability and related others by exploring similar questions and additional content below.Recommended textbooks for you
College Algebra
Algebra
ISBN:
9781305115545
Author:
James Stewart, Lothar Redlin, Saleem Watson
Publisher:
Cengage Learning

College Algebra
Algebra
ISBN:
9781305115545
Author:
James Stewart, Lothar Redlin, Saleem Watson
Publisher:
Cengage Learning