The contingency table below shows the results of a survey of video viewing habits by age. Video Viewing Platform Preferred Mobile/Laptop Viewer Age Device TV Screen Row Total 18 to 34 31 36 67 35 to 54 8. 8 16 55+ 11 17 Column Total 45 55 100 Find the following probabilities or percentages: (a) Probability that a viewer is aged 18 to 34. (Round your answer to 2 decimal places.) Probability (b) Probability that a viewer prefers watching videos on a TV screen. (Round your answer to 2 decimal places.) Probability
The contingency table below shows the results of a survey of video viewing habits by age. Video Viewing Platform Preferred Mobile/Laptop Viewer Age Device TV Screen Row Total 18 to 34 31 36 67 35 to 54 8. 8 16 55+ 11 17 Column Total 45 55 100 Find the following probabilities or percentages: (a) Probability that a viewer is aged 18 to 34. (Round your answer to 2 decimal places.) Probability (b) Probability that a viewer prefers watching videos on a TV screen. (Round your answer to 2 decimal places.) Probability

Chapter8: Sequences, Series,and Probability
Section8.7: Probability
Problem 4ECP: Show that the probability of drawing a club at random from a standard deck of 52 playing cards is...

Related questions
Question
Last question: (e) Percentage of viewers who are 35 to 54 or prefer videos on a mobile or laptop device
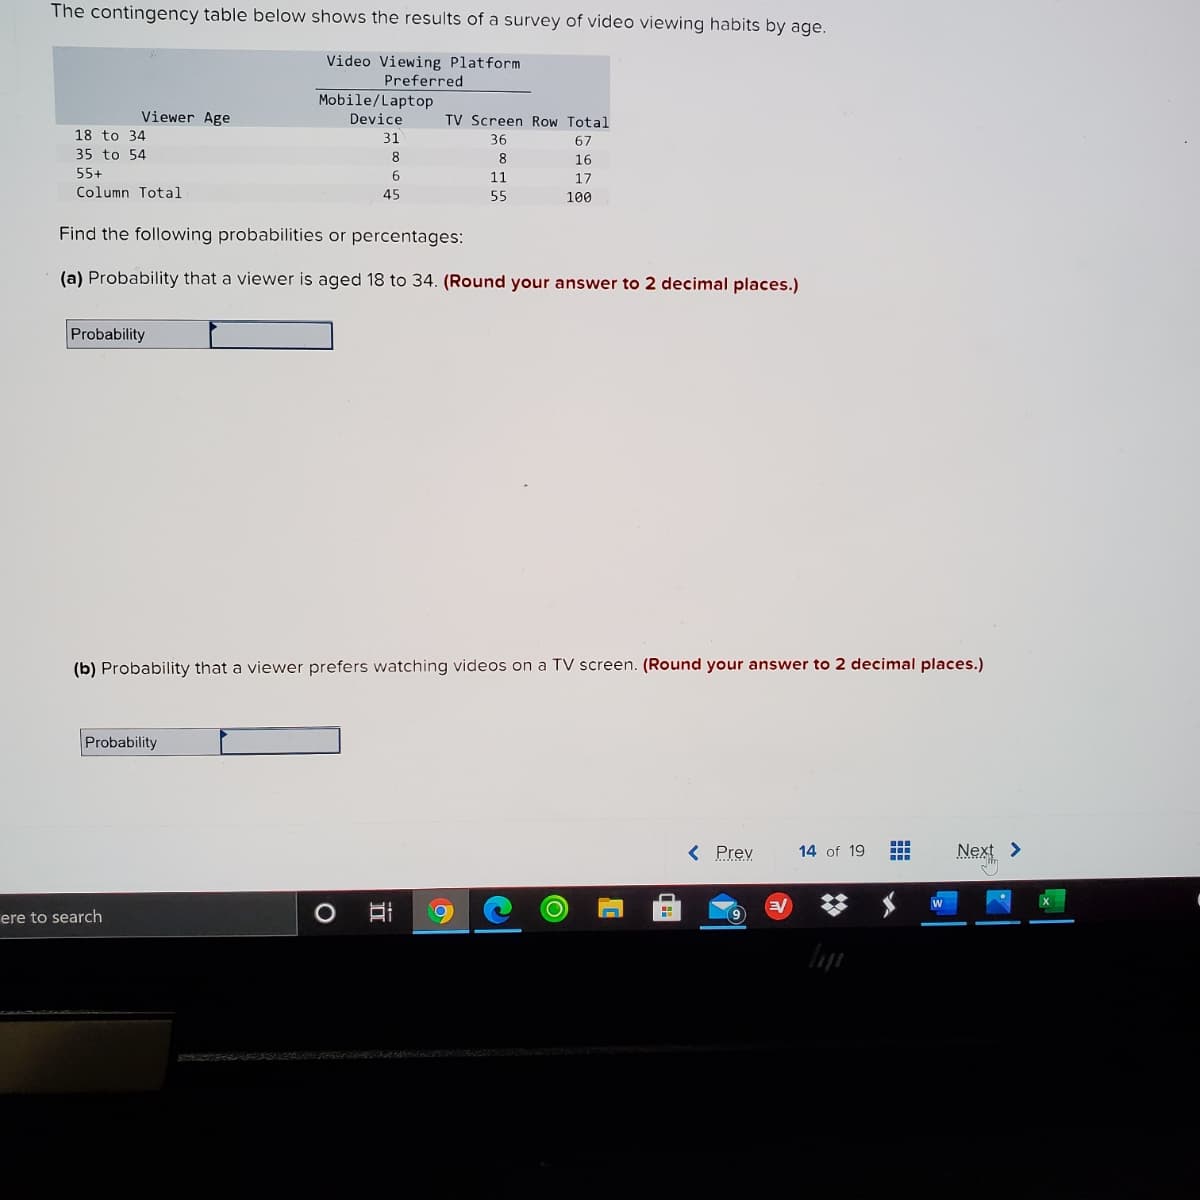
Transcribed Image Text:The contingency table below shows the results of a survey of video viewing habits by age.
Video Viewing Platform
Preferred
Mobile/Laptop
Viewer Age
Device
TV Screen Row Total
18 to 34
31
36
67
35 to 54
8
8
16
55+
11
17
Column Total
45
55
100
Find the following probabilities or percentages:
(a) Probability that a viewer is aged 18 to 34. (Round your answer to 2 decimal places.)
Probability
(b) Probability that a viewer prefers watching videos on a TV screen. (Round your answer to 2 decimal places.)
Probability
< Prev
Next >
14 of 19
I..
ere to search
Transcribed Image Text:mheducation.com/ext/map/index.html?_con=Dcon&external_browser=0&launchUrl=https%253A%252F%252FP
I Login
1 Airport Customer S...
O Ubisoft | Welcome t..
BUZZ Blizzard Entertainm. Southern New Ham..
C...
I mySNHU Login
a Amazon.com. Spen.
Saved
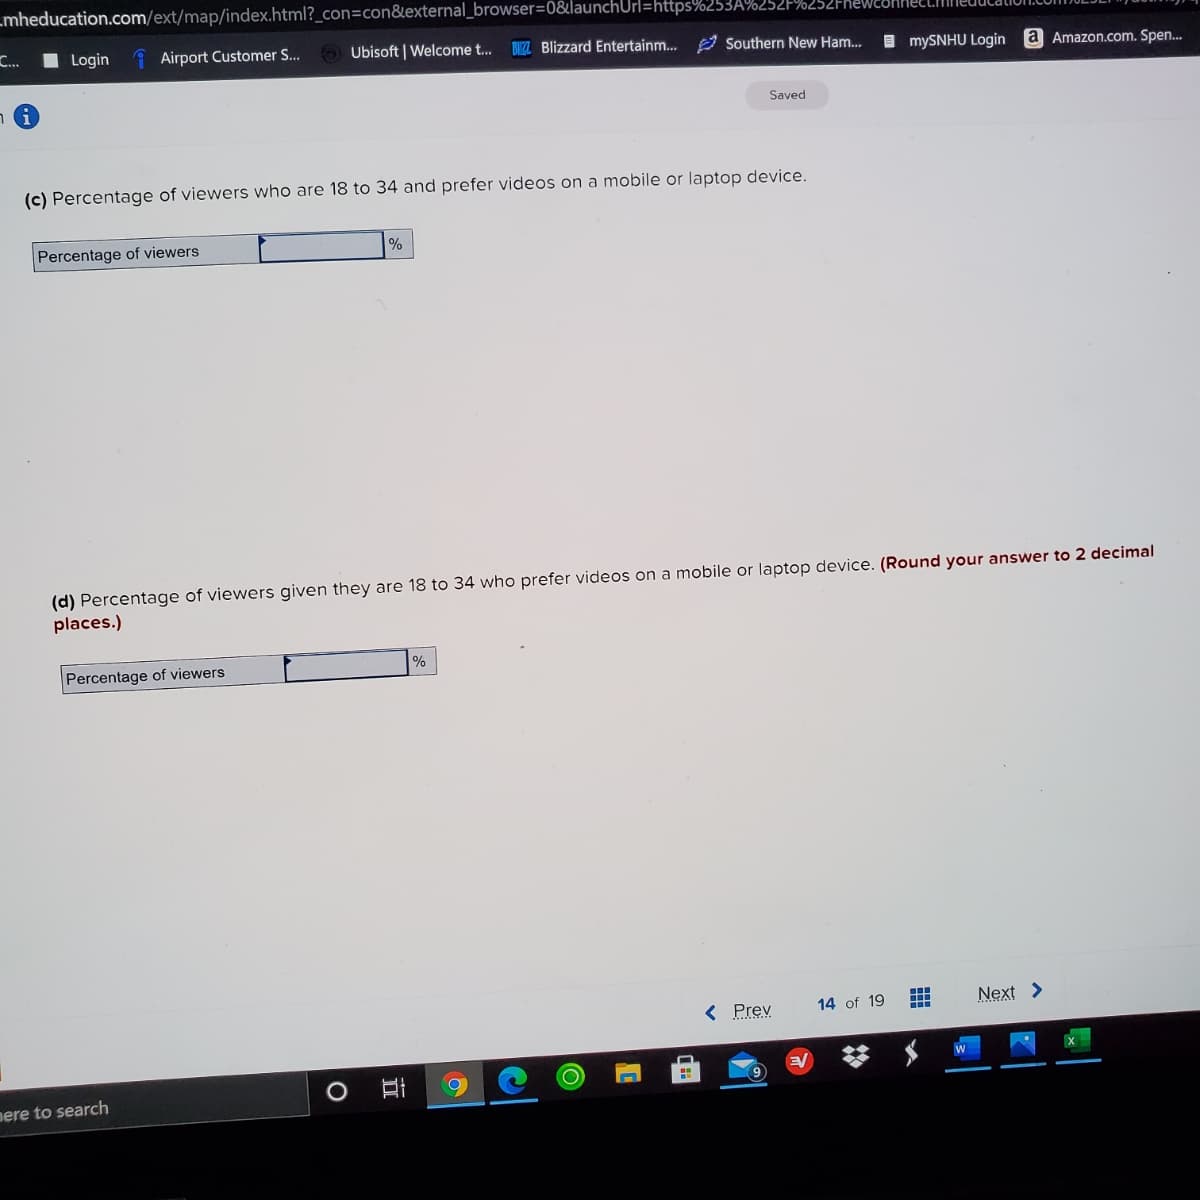
(c) Percentage of viewers who are 18 to 34 and prefer videos on a mobile or laptop device.
Percentage of viewers
(d) Percentage of viewers given they are 18 to 34 who prefer videos on a mobile or laptop device. (Round your answer to 2 decimal
places.)
Percentage of viewers
%
< Prev
14 of 19
Next >
nere to search
近
Expert Solution
This question has been solved!
Explore an expertly crafted, step-by-step solution for a thorough understanding of key concepts.

This is a popular solution!

Trending now
This is a popular solution!

Step by step
Solved in 4 steps

Recommended textbooks for you