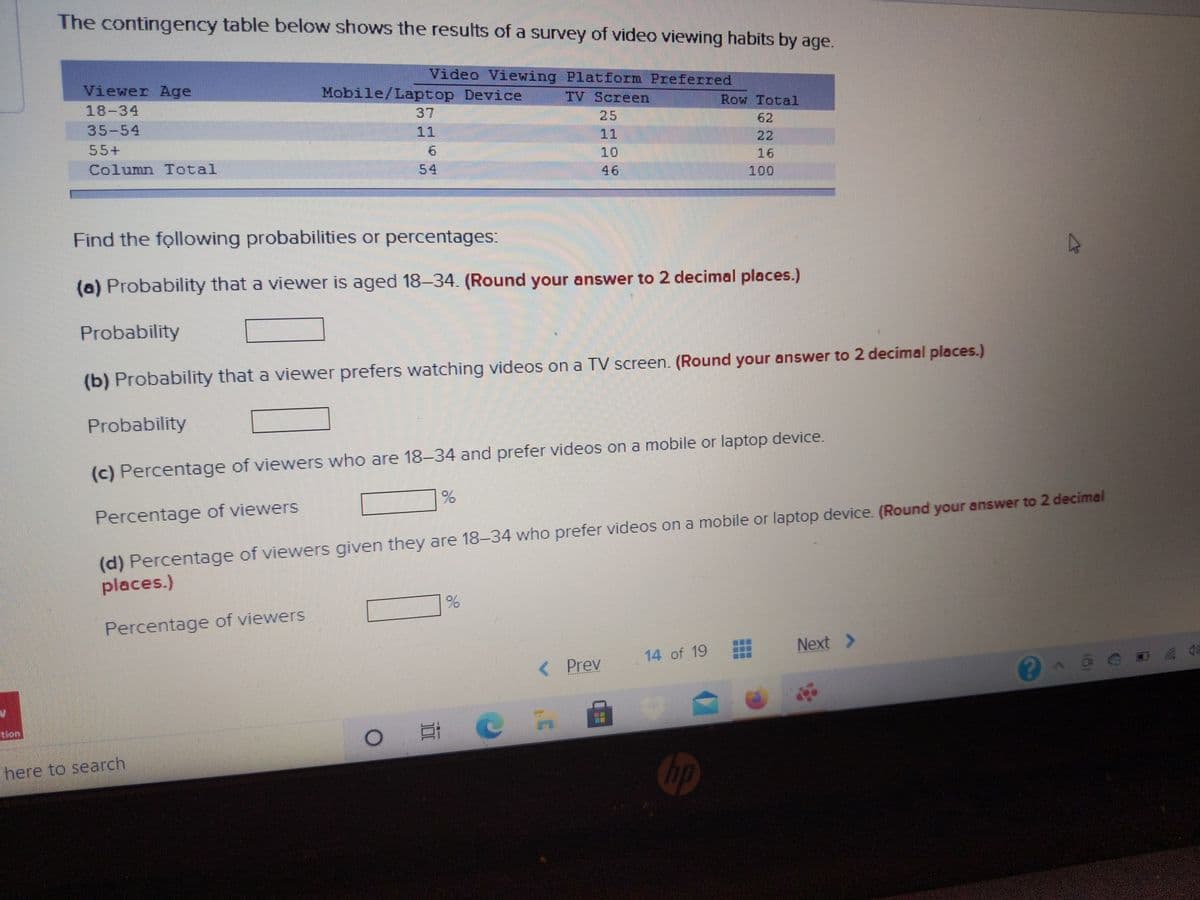
The contingency table below shows the results of a survey of video viewing habits by age. Video Viewing Platform Preferred Viewer Age 18-34 35-54 Mobile/Laptop Device TV Screen Row Total 37 25 62 11 11 22 55+ 10 16 Column Total 54 46 100 Find the following probabilities or percentages: (a) Probability that a viewer is aged 18-34. (Round your answer to 2 decimal places.) Probability (b) Probability that a viewer prefers watching videos on a TV screen. (Round your answer to 2 decimal places.) Probability (c) Percentage of viewers who are 18–34 and prefer videos on a mobile or laptop device. (d) Percentage of viewers given they are 18-34 who prefer videos on a mobile or laptop device. (Round your answer to 2 decimal places.) Percentage of viewers Percentage of viewers Next > 14 of 19


Addition Rule of Probability
It simply refers to the likelihood of an event taking place whenever the occurrence of an event is uncertain. The probability of a single event can be calculated by dividing the number of successful trials of that event by the total number of trials.
Expected Value
When a large number of trials are performed for any random variable ‘X’, the predicted result is most likely the mean of all the outcomes for the random variable and it is known as expected value also known as expectation. The expected value, also known as the expectation, is denoted by: E(X).
Probability Distributions
Understanding probability is necessary to know the probability distributions. In statistics, probability is how the uncertainty of an event is measured. This event can be anything. The most common examples include tossing a coin, rolling a die, or choosing a card. Each of these events has multiple possibilities. Every such possibility is measured with the help of probability. To be more precise, the probability is used for calculating the occurrence of events that may or may not happen. Probability does not give sure results. Unless the probability of any event is 1, the different outcomes may or may not happen in real life, regardless of how less or how more their probability is.
Basic Probability
The simple definition of probability it is a chance of the occurrence of an event. It is defined in numerical form and the probability value is between 0 to 1. The probability value 0 indicates that there is no chance of that event occurring and the probability value 1 indicates that the event will occur. Sum of the probability value must be 1. The probability value is never a negative number. If it happens, then recheck the calculation.
We jave to find probability using formula
Probability of event =favorable outcome/total possible outcome

Trending now
This is a popular solution!

Step by step
Solved in 2 steps


