The contingency table shows the results of a random sample of adults with respect to their ages and favorite fast food restaurant. At the significance level, a=0.01, test the claim that at least two of the variables are dependent. Use the Independence #1 calculator to test the hypothesis. Fill in the contingency table for row and columns based on the results. Also fill in the space for the level of significance a H_0: The variables are independent H_a: At least two of the variables are dependent (claim) a.) Find the degrees of freedom, the critical value and identify the rejection region. b.) Find the chi-square test statistic c.) Is the test statistic in the rejection region? How do you know?
The contingency table shows the results of a random sample of adults with respect to their ages and favorite fast food restaurant. At the significance level, a=0.01, test the claim that at least two of the variables are dependent. Use the Independence #1 calculator to test the hypothesis. Fill in the contingency table for row and columns based on the results. Also fill in the space for the level of significance a H_0: The variables are independent H_a: At least two of the variables are dependent (claim) a.) Find the degrees of freedom, the critical value and identify the rejection region. b.) Find the chi-square test statistic c.) Is the test statistic in the rejection region? How do you know?

Algebra & Trigonometry with Analytic Geometry
13th Edition
ISBN:9781133382119
Author:Swokowski
Publisher:Swokowski
Chapter1: Fundamental Concepts Of Algebra
Section1.1: Real Numbers
Problem 51E

Related questions
Question
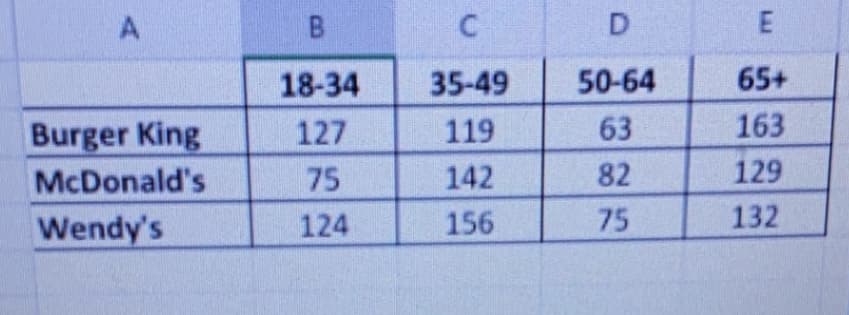
Transcribed Image Text:18-34
35-49
50-64
65+
Burger King
127
119
63
163
McDonald's
75
142
82
129
Wendy's
124
156
75
132
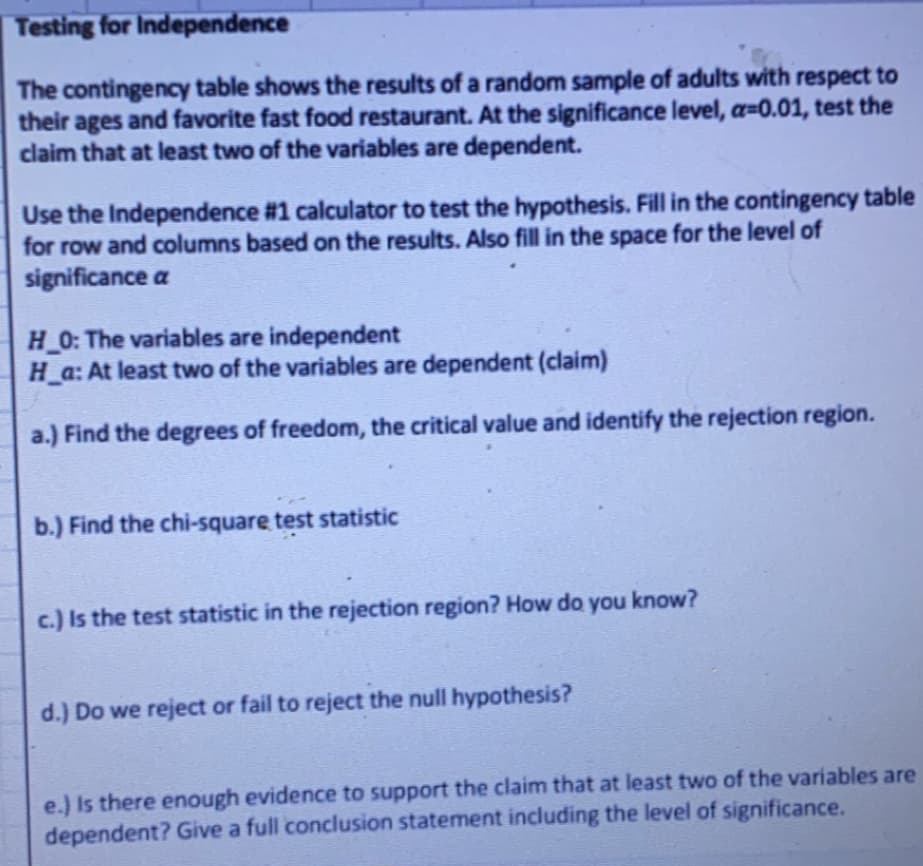
Transcribed Image Text:Testing for Independence
The contingency table shows the results of a random sample of adults with respect to
their ages and favorite fast food restaurant. At the significance level, a=0.01, test the
claim that at least two of the variables are dependent.
Use the Independence #1 calculator to test the hypothesis. Fill in the contingency table
for row and columns based on the results. Also fill in the space for the level of
significance a
H 0: The variables are independent
H a: At least two of the variables are dependent (claim)
a.) Find the degrees of freedom, the critical value and identify the rejection region.
b.) Find the chi-square test statistic
c.) Is the test statistic in the rejection region? How do you know?
d.) Do we reject or fail to reject the null hypothesis?
e.) Is there enough evidence to support the claim that at least two of the variables are
dependent? Give a full conclusion statement including the level of significance.
Expert Solution
This question has been solved!
Explore an expertly crafted, step-by-step solution for a thorough understanding of key concepts.

This is a popular solution!

Trending now
This is a popular solution!

Step by step
Solved in 4 steps with 1 images

Recommended textbooks for you
Algebra & Trigonometry with Analytic Geometry
Algebra
ISBN:
9781133382119
Author:
Swokowski
Publisher:
Cengage

College Algebra (MindTap Course List)
Algebra
ISBN:
9781305652231
Author:
R. David Gustafson, Jeff Hughes
Publisher:
Cengage Learning
Algebra & Trigonometry with Analytic Geometry
Algebra
ISBN:
9781133382119
Author:
Swokowski
Publisher:
Cengage
College Algebra (MindTap Course List)
Algebra
ISBN:
9781305652231
Author:
R. David Gustafson, Jeff Hughes
Publisher:
Cengage Learning