The covariance between stocks A and B is 0.0014, standard deviation of stock A is 0.032, and standard deviation of stock B is 0.044. Which of the following is the most appropriate to depict the risk-return characteristics of a portfolio consisting of only stocks A and B, and explain why? E(R) E(R) E(R) В В A A А (A) (B) (C)
The covariance between stocks A and B is 0.0014, standard deviation of stock A is 0.032, and standard deviation of stock B is 0.044. Which of the following is the most appropriate to depict the risk-return characteristics of a portfolio consisting of only stocks A and B, and explain why? E(R) E(R) E(R) В В A A А (A) (B) (C)

Intermediate Financial Management (MindTap Course List)
13th Edition
ISBN:9781337395083
Author:Eugene F. Brigham, Phillip R. Daves
Publisher:Eugene F. Brigham, Phillip R. Daves
Chapter3: Risk And Return: Part Ii
Section: Chapter Questions
Problem 1P: The standard deviation of stock returns for Stock A is 40%. The standard deviation of the market...

Related questions
Question
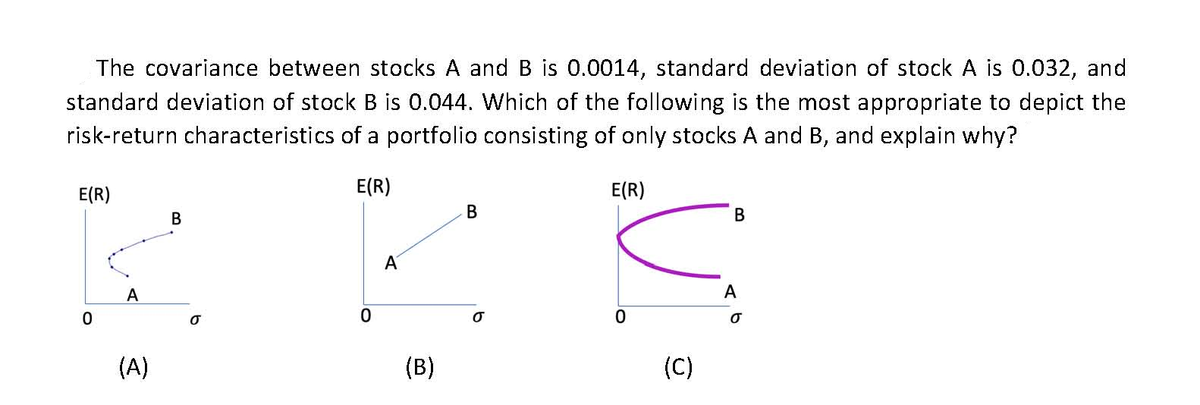
Transcribed Image Text:The covariance between stocks A and B is 0.0014, standard deviation of stock A is 0.032, and
standard deviation of stock B is 0.044. Which of the following is the most appropriate to depict the
risk-return characteristics of a portfolio consisting of only stocks A and B, and explain why?
E(R)
E(R)
E(R)
В
В
A
A
А
(A)
(B)
(C)
Expert Solution
This question has been solved!
Explore an expertly crafted, step-by-step solution for a thorough understanding of key concepts.

Step by step
Solved in 2 steps with 1 images

Recommended textbooks for you
Intermediate Financial Management (MindTap Course…
Finance
ISBN:
9781337395083
Author:
Eugene F. Brigham, Phillip R. Daves
Publisher:
Cengage Learning

EBK CONTEMPORARY FINANCIAL MANAGEMENT
Finance
ISBN:
9781337514835
Author:
MOYER
Publisher:
CENGAGE LEARNING - CONSIGNMENT

Intermediate Financial Management (MindTap Course…
Finance
ISBN:
9781337395083
Author:
Eugene F. Brigham, Phillip R. Daves
Publisher:
Cengage Learning
EBK CONTEMPORARY FINANCIAL MANAGEMENT
Finance
ISBN:
9781337514835
Author:
MOYER
Publisher:
CENGAGE LEARNING - CONSIGNMENT