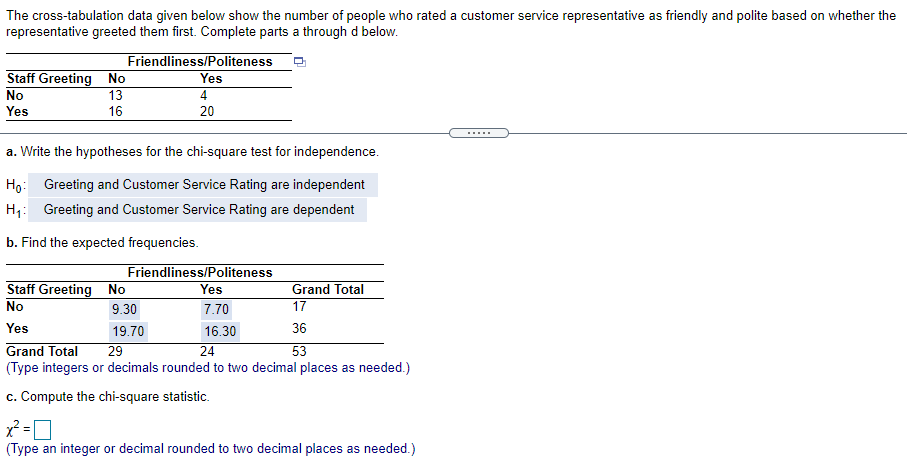
The cross-tabulation data given below show the number of people who rated a customer service representative as friendly and polite based on whether the representative greeted them first. Complete parts a through d below. Friendliness/Politeness Staff Greeting No Yes No 13 16 4 Yes 20 ......
Q: Which questions would you pair to form a cross tabulation to uncover the following relationships?…
A: The following are the pairs of questions used to form a cross tabulation from a set of data that…
Q: Q.5 Fit a straight line of the best fit from the following data. Year Imports 2011 2012 2013 2014…
A: Q.5 The regression analysis is conducted using EXCEL. The software procedure is given below: Enter…
Q: A pediatrician wants to determine the relation that exists between a child's height, x, and head…
A: 1. Find Regression line equations from the following data X Y 28 17.6 24.75 17.2 25.75 17.2…
Q: Using the following stem & leaf plot, find the five number summary for the data. 1|0 2 2|3 44 3|1…
A:
Q: The mode for the data: 22,17,18,25,22,52,27,33 is equal to (2 Points) O 18 17 O 22 O 27
A: We have to find mode of the data .....
Q: Given the following data: 260 380 360 320 325 350 340 370 340 520 340 325 350 250 280 300 340 360…
A: The values of five number summary are : {Min, Q1, Median, Q3, Max} = {250, 300, 340, 357.5, 520}
Q: Use the given data set to complete parts (a) through (c) below. (Use a = 0.05.) 10 8 13 9 11 14 6 4…
A:
Q: What is the interquartile range (1QR) of the data set represented by this box plot? 30 10 30 40 50…
A: Given, A boxplot with all its necessary values . Calculate, the interquartile range(IQR). Formulae…
Q: An agent for a residential real estate company in a suburb located outside a major city has the…
A: Monthly Rent ($) 925 1,550 800 1,450 1,950 950 1,800 1,300 Size (Square Feet) 800 1,350 1,050…
Q: Consider the following box and whisker plot. Find the indicated values of the represented data. 26…
A: Given: A box and whisker plot is provided. A box and whisker plot represents the summary of the…
Q: Find the interquartile range of the data shown on the box-an whisker plot below. + + + 10 20 30 40…
A: TO FIND : THE INTERQUARTILE RANGE OF THE DATA SHOWN ON THE BOX AND WHISKER PLOT
Q: New Bank (NB) believes that there is a relationship between the kilometres (KM) travelled by its…
A: Independent variable: The variable which can be changed is known as independent variable. Dependent…
Q: Construct a bar graph that represents the following data regarding per game scoring average by NBA…
A: A bar graph is used to represent the data graphically using vertical or horizontal bars. The bar…
Q: Each section of a box plot represents 25% of the data. Cada sección de un diagrama de caja…
A:
Q: The segmented bar graphs below depict data from the NAAL (National Assessment of Adult Literacy)…
A: Solution: There exists relationship among volunteerism-never, Less than once per week and Once per…
Q: SEE Data Table Below Part Quality Minor Major Defect Defect Supplier Good 100 A 5 8 B 160 22 4 150 7…
A: Given: The data contains the part based on the data three suppliers. The value is said to be 0.05.…
Q: Using the scatter plot provided, list all of the ordered pairs plotted. 320 300 280 260 240 220 200…
A: Given query is to find plotted pairs.
Q: Find the minimum, first quartile, median, third quartile, and maximum of the data set. 6. 155 162…
A: 6) Given data: 155, 162, 141, 199, 150, 168, 175 To find minimum, first quartile, median, third…
Q: Based on the data collected to check if income and graduation have any relation, following two-way…
A: The given experiment is to be conducted to test the significant association between annual income…
Q: Draw a box and whisker plot of the data on the diagram below.…
A: We have used Excel to solve the question. First the enter the data in an Excel sheet. Enter the…
Q: Draw the scatter plot for the following data: x 100 200 300 400 500 5 25 45 65 85
A: Given data is x 100 200 300 400 500 y 5 25 45 65 85
Q: Find the range for the set of data given. 21) 111 484 170 617 360 290 A) 484 B) 111 C) 120 D) 506
A: The given data is, 111, 484, 170, 617, 360, 290.
Q: A simple qualitative data set has been provided. Use this data set to complete parts (a) through (d)…
A:
Q: The accompanying table contains the number of partners in a cohort of rising accounting firms that…
A: The five number summary is minimum, first quartile, median, third quartile and maximum values of the…
Q: Use descriptions of shape, center, and spread to compare the distribution of calories in adult and…
A: We are given the two graphs of distribution of calories in adult and child cereals and we have to…
Q: Using the following stem & leaf plot, find the five number summary for the data by hand. 1|7 8 2|1…
A: The stem and leaf plot is given as follows.
Q: Which of the following variables has an ordinal scale 1. O Umur mahasiswa/ Student age 2. O…
A: Ordinal data: Nominal data also measure qualitative data but it measure in ordered. Example: High…
Q: The value of an explanatory variable is 14, while the corresponding value of the response variable…
A:
Q: The result of the ITech Marathon is declared as First, Second, and Third rank only. Such data is…
A: Ordinal level data deals with rankings. Thus, such data is called ordinal level data.
Q: The following table shows data for the first and second Quiz scores for 8 students in a class. First…
A: Given data: First Quiz Second Quiz 17 16 23 21 28 25 31 26 34 30 37 34 41 37 42…
Q: After giving a statistics exam, Professor Dang determined the following five-number summary for her…
A: The given five- number summary for her class results are: 60 68 77 89 98 The five…
Q: The following data set shows the distances a car drives (in miles) on a full tank of gas after…
A: Five number summary is, Min, Q1, Median, Q3, Max Min= 215 Sample size is n=15 First quartile, Q1=…
Q: Use the given data to complete parts (a) (0) below. y o 2.2 3.8 1.5 2.9 3.7 4.6 4.9 4 (a) Draw a…
A: A scatterplot is a type of plot that is used to represent values for two variables for a set of…
Q: The tollowing is data for the tirst and second Quiz Scores for 8 students in First Quiz Second Quiz…
A: Given,
Q: Q.5 Fit a straight line of the best fit from the following data. Year Imports 2011 | 2012 | 2013 |…
A: Therefore, using excel software fit a straight line of the given data by using following steps,…
Q: A pet store keeps track of the purchases of customers over a four-hour period. The store manager…
A: Since you have answered multiple subparts therefore we will answer the first three subparts for you,…
Q: After giving a statistics exam, Professor Dang determined the following five-number summary for her…
A: The box plot contains 5-number summary. That is, the minimum value, the first quartile, the second…
Q: The data set given below consists of seven pairs of (x, y); (766, 280) (201, 50) (218, 41) (519,…
A: The given data is, x y 201 50 766 280 148 27 218 41 519 108 396 82 274 63
Q: The following data are the number of pages in 40 books on a shelf. 119; 140; 178; 190; 205; 215;…
A: sample size(n)=40the given data is already arranged in ascending order.
Q: The following is data for the first and second Quiz scores for 8 students in a class. First Quiz…
A: Given: The provided data is: First Quiz Second Quiz 11 11 18 13 19 17 24 19 42 39 44…
Q: Classify each of the following as nominal, ordinal, interval, or ratio data and explain. a. the…
A: The objective is to classify each of the following as nominal, ordinal, interval, or ratio data.
Q: a. Construct a histogram and a percentage polygon. b. On the basis of the results in (a) and (b),…
A: Histogram : To construct a histogram for the given data please refer the following steps. First step…
Q: Using the following stem & leaf plot, find the five number summary for the data. 0 2 3 4 4 59 3 4 2…
A:
Q: The following data are the maximum temperatures (in degrees Fahrenheit) of 17 cities in the United…
A: Arrange the given data in ascending order53 , 54,56, 59 , 61, 65, 66, 70,70, 71 ,73 , 74 , 76, 76,…
Q: Using the same scale, draw a box-and-whisker plot for each of the two data sets, placing the second…
A: Arrange the data in ascending order. NBA 75 76 77 77 77 78 79 79 79 79 82…
Q: Which is the line-of-best-fit for the data represented below? Height Weight Tim 67 160 Evan 73…
A: Given the data We need to find the equation y=mx+b without using a calculator nor excel.
Q: The number of household members, x, and the amount spent on groceries per week, y, are measured for…
A: Solution-: Given data: X: 2,2,3,4,1,5 Y: 95.75,110.19,118.33,150.92,85.86,180.62
Q: Use this data set to answer the following questions. (CSLO 1,2,7) 115 184 191 216 153 185 194 183…
A: Given data: 115, 191, 153, 194, 236, 184, 216, 185, 183, 202 Interquartile range is a measure of…
Q: The following table shows the length, in centimeters, of the humerus and the total wingspan, in…
A:
Trending now
This is a popular solution!
Step by step
Solved in 2 steps