New Bank (NB) believes that there is a relationship between the kilometres (KM) travelled by its customers and the charges on their cards (CC). The bank collected the data given in Table NB Table NB Dollars (USS'00) 18 Kilometres ('00) 12 24 15 20 12
New Bank (NB) believes that there is a relationship between the kilometres (KM) travelled by its customers and the charges on their cards (CC). The bank collected the data given in Table NB Table NB Dollars (USS'00) 18 Kilometres ('00) 12 24 15 20 12

MATLAB: An Introduction with Applications
6th Edition
ISBN:9781119256830
Author:Amos Gilat
Publisher:Amos Gilat
Chapter1: Starting With Matlab
Section: Chapter Questions
Problem 1P

Related questions
Question
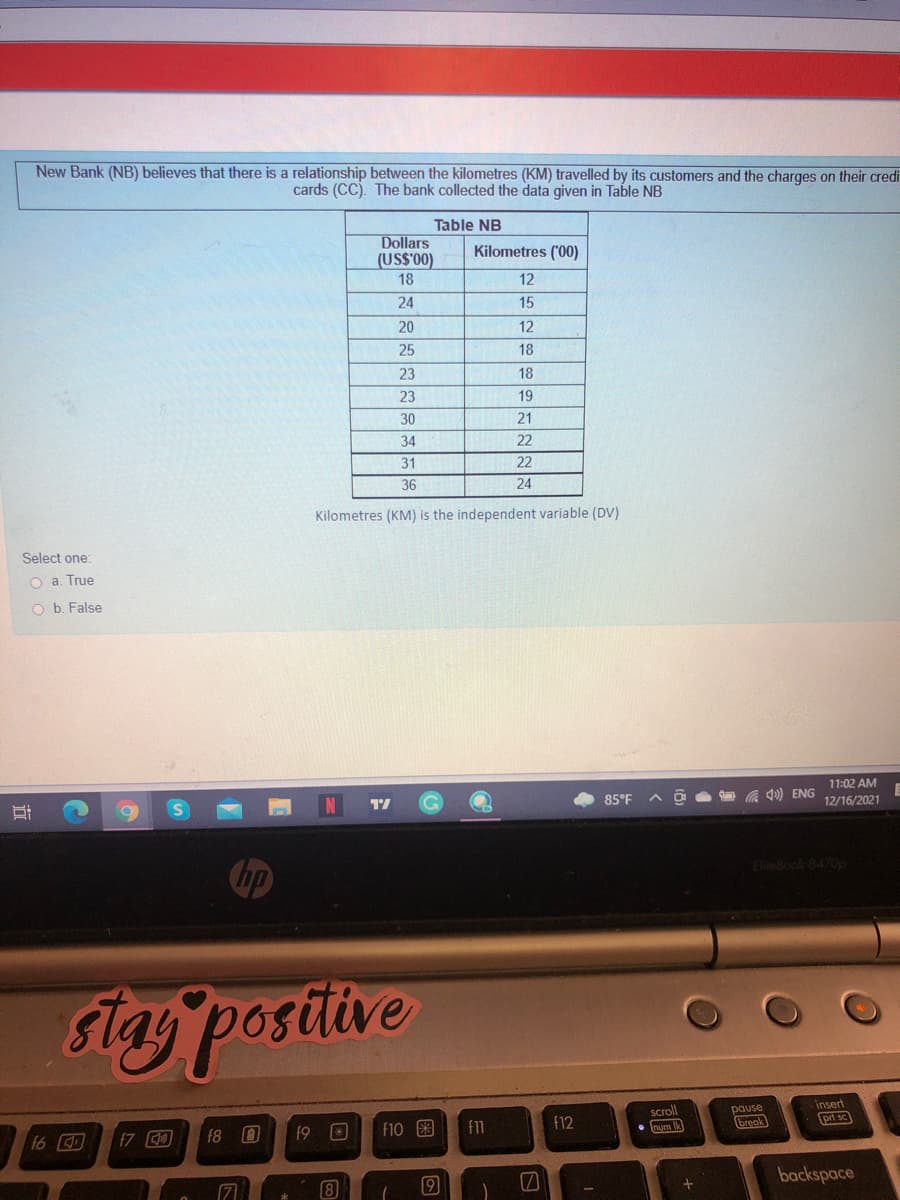
Transcribed Image Text:New Bank (NB) believes that there is a relationship between the kilometres (KM) travelled by its customers and the charges on their credi
cards (CC). The bank collected the data given in Table NB
Table NB
Dollars
(US$'00)
Kilometres ('00)
18
12
24
15
20
12
25
18
23
18
23
19
30
21
34
22
31
36
24
Kilometres (KM) is the independent variable (DV)
Select one:
O a. True
O b. False
11:02 AM
4) ENG
85°F
12/16/2021
Chp
ElieBook 8470p
stay positive
scroll
num k
pause
break
insert
pri sc
f10
f1
f12
16
17 0
f8 0
f9
backspace
8
Expert Solution
This question has been solved!
Explore an expertly crafted, step-by-step solution for a thorough understanding of key concepts.

Step by step
Solved in 2 steps

Recommended textbooks for you
MATLAB: An Introduction with Applications
Statistics
ISBN:
9781119256830
Author:
Amos Gilat
Publisher:
John Wiley & Sons Inc

Probability and Statistics for Engineering and th…
Statistics
ISBN:
9781305251809
Author:
Jay L. Devore
Publisher:
Cengage Learning

Statistics for The Behavioral Sciences (MindTap C…
Statistics
ISBN:
9781305504912
Author:
Frederick J Gravetter, Larry B. Wallnau
Publisher:
Cengage Learning
MATLAB: An Introduction with Applications
Statistics
ISBN:
9781119256830
Author:
Amos Gilat
Publisher:
John Wiley & Sons Inc
Probability and Statistics for Engineering and th…
Statistics
ISBN:
9781305251809
Author:
Jay L. Devore
Publisher:
Cengage Learning
Statistics for The Behavioral Sciences (MindTap C…
Statistics
ISBN:
9781305504912
Author:
Frederick J Gravetter, Larry B. Wallnau
Publisher:
Cengage Learning

Elementary Statistics: Picturing the World (7th E…
Statistics
ISBN:
9780134683416
Author:
Ron Larson, Betsy Farber
Publisher:
PEARSON

The Basic Practice of Statistics
Statistics
ISBN:
9781319042578
Author:
David S. Moore, William I. Notz, Michael A. Fligner
Publisher:
W. H. Freeman

Introduction to the Practice of Statistics
Statistics
ISBN:
9781319013387
Author:
David S. Moore, George P. McCabe, Bruce A. Craig
Publisher:
W. H. Freeman