The current year financial statements for Blue Water Company and Prime Fish Company are presented below. Balance sheet Cash Accounts receivable (net) Inventory Property & equipment (net) Other assets Total assets Current liabilities Long-term debt (interest rate: 10%) Capital stock ($10 par value) Additional paid-in capital Retained earnings Total liabilities and stockholders' equity Income statement Sales revenue (1/3 on credit) Cost of goods sold Operating expenses Net income Other data Per share stock price at end of current year Average income tax rate Dividends declared and paid in current year. Profitability ratios: Ratio 1. Return on equity ratio 2. Return on assets ratio 3. Gross profit margin 4. Net profit margin ratio 5. Earnings per share ratio Asset turnover ratios: 6. Total asset turnover ratio 7. Fixed asset turnover ratio 8. Receivable turnover ratio 9. Inventory turnover ratio Liquidity ratios: 10. Current ratio 11. Quick ratio 12. Cash ratio Solvency ratios: 13. Debt to equity ratio Market ratios: 14. Price earnings ratio 15. Dividend yield ratio BLUE WATER COMPANY Both companies are in the fish catching and manufacturing business. Both have been in business approximately 10 years, and each has had steady growth. The management of each has a different viewpoint in many respects. Blue Water is more conservative, and as its president has said, "We avoid what we consider to be undue risk." Neither company is publicly held. % % Blue Water Prime Fish $ 21,000 31,000 40,000 401,000 305,000 $ 798,000 Required: 1. Using year-end balances for all ratios, compute the following ratios: Note: Round your intermediate calculations and final answers to 2 decimal places. Enter percentage answers rounded to 2 decimal places (i.e. 0.1234 should be entered as 12.34). % % % $ 41,000 38,000 99,000 140,000 84,000 $ 402,000 PRIME FISH COMPANY 29,000 61,000 $ 402,000 $ 447,000 (241,000) (161,000) $ 45,000 $ 99,000 65,000 148,000 % % % % $ 22 30% % $ 33,000 $ 49,000 60,000 512,000 106,000 71,000 $ 798,000 $ 802,000 (400,000) (311,000) $ 91,000 $ 15 30% $ 148,000
The current year financial statements for Blue Water Company and Prime Fish Company are presented below. Balance sheet Cash Accounts receivable (net) Inventory Property & equipment (net) Other assets Total assets Current liabilities Long-term debt (interest rate: 10%) Capital stock ($10 par value) Additional paid-in capital Retained earnings Total liabilities and stockholders' equity Income statement Sales revenue (1/3 on credit) Cost of goods sold Operating expenses Net income Other data Per share stock price at end of current year Average income tax rate Dividends declared and paid in current year. Profitability ratios: Ratio 1. Return on equity ratio 2. Return on assets ratio 3. Gross profit margin 4. Net profit margin ratio 5. Earnings per share ratio Asset turnover ratios: 6. Total asset turnover ratio 7. Fixed asset turnover ratio 8. Receivable turnover ratio 9. Inventory turnover ratio Liquidity ratios: 10. Current ratio 11. Quick ratio 12. Cash ratio Solvency ratios: 13. Debt to equity ratio Market ratios: 14. Price earnings ratio 15. Dividend yield ratio BLUE WATER COMPANY Both companies are in the fish catching and manufacturing business. Both have been in business approximately 10 years, and each has had steady growth. The management of each has a different viewpoint in many respects. Blue Water is more conservative, and as its president has said, "We avoid what we consider to be undue risk." Neither company is publicly held. % % Blue Water Prime Fish $ 21,000 31,000 40,000 401,000 305,000 $ 798,000 Required: 1. Using year-end balances for all ratios, compute the following ratios: Note: Round your intermediate calculations and final answers to 2 decimal places. Enter percentage answers rounded to 2 decimal places (i.e. 0.1234 should be entered as 12.34). % % % $ 41,000 38,000 99,000 140,000 84,000 $ 402,000 PRIME FISH COMPANY 29,000 61,000 $ 402,000 $ 447,000 (241,000) (161,000) $ 45,000 $ 99,000 65,000 148,000 % % % % $ 22 30% % $ 33,000 $ 49,000 60,000 512,000 106,000 71,000 $ 798,000 $ 802,000 (400,000) (311,000) $ 91,000 $ 15 30% $ 148,000

College Accounting, Chapters 1-27 (New in Accounting from Heintz and Parry)
22nd Edition
ISBN:9781305666160
Author:James A. Heintz, Robert W. Parry
Publisher:James A. Heintz, Robert W. Parry
Chapter15: Financial Statements And Year-end Accounting For A Merchandising Business
Section: Chapter Questions
Problem 4CE

Related questions
Question
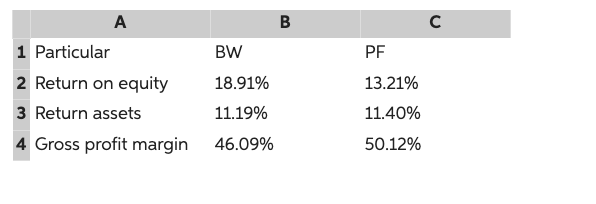
Transcribed Image Text:A
1 Particular
2 Return on equity
3 Return assets
4 Gross profit margin
BW
18.91%
11.19%
46.09%
B
PF
13.21%
11.40%
50.12%
с
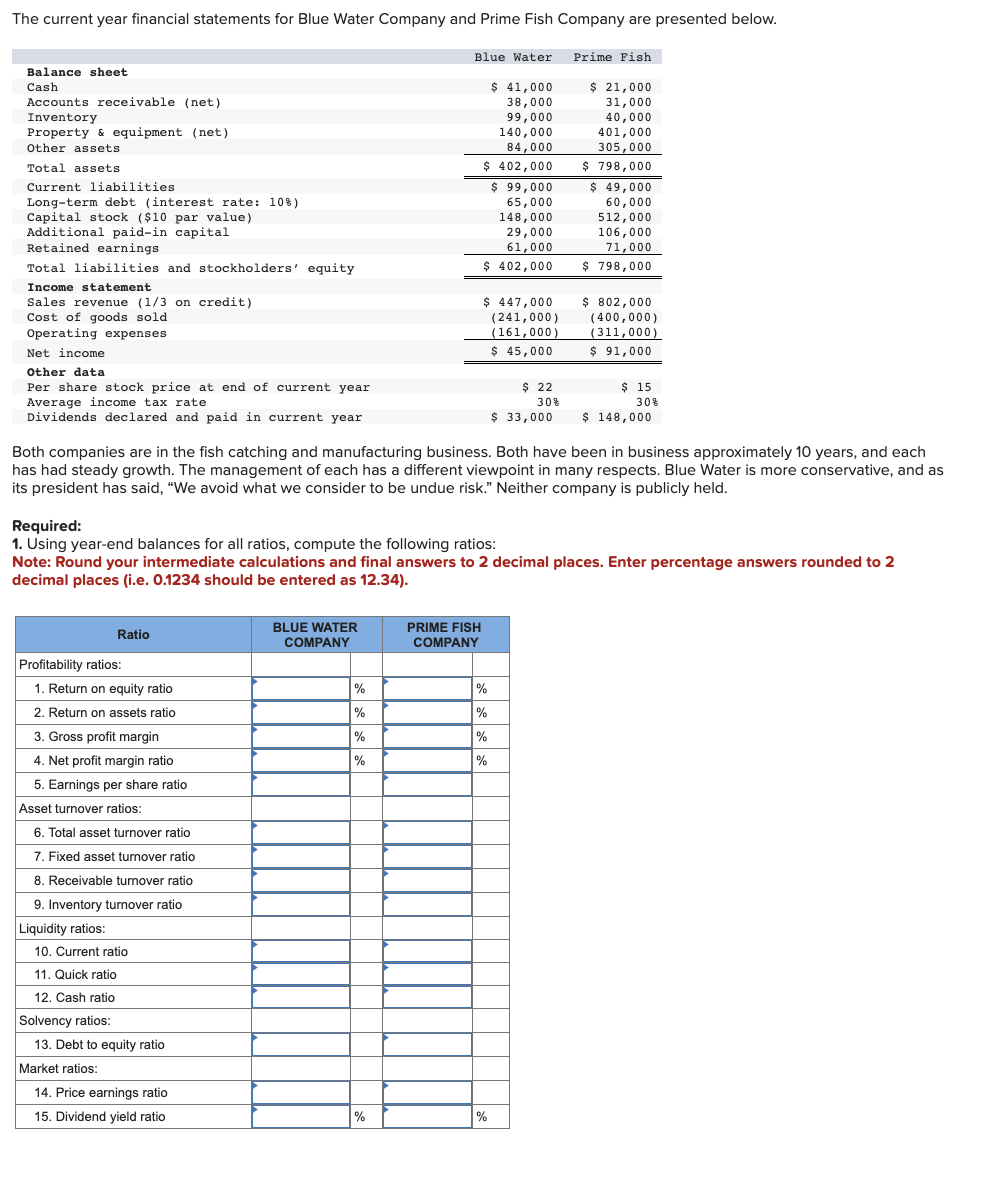
Transcribed Image Text:The current year financial statements for Blue Water Company and Prime Fish Company are presented below.
Balance sheet
Cash
Accounts receivable (net)
Inventory
Property & equipment (net)
Other assets
Total assets
Current liabilities
Long-term debt (interest rate: 10 %)
Capital stock ($10 par value)
Additional paid-in capital
Retained earnings
Total liabilities and stockholders' equity
Income statement
Sales revenue (1/3 on credit)
Cost of goods sold.
Operating expenses
Net income
Other data
Per share stock price at end of current year
Average income tax rate
Dividends declared and paid in current year
Required:
1. Using year-end balances for all ratios, compute the following ratios:
Profitability ratios:
Ratio
1. Return on equity ratio
2. Return on assets ratio
3. Gross profit margin
4. Net profit margin ratio
5. Earnings per share ratio
Asset turnover ratios:
6. Total asset turnover ratio
7. Fixed asset turnover ratio
8. Receivable turnover ratio
9. Inventory turnover ratio
Liquidity ratios:
10. Current ratio
11. Quick ratio
12. Cash ratio
Solvency ratios:
Both companies are in the fish catching and manufacturing business. Both have been in business approximately 10 years, and each
has had steady growth. The management of each has a different viewpoint in many respects. Blue Water is more conservative, and as
its president has said, "We avoid what we consider to be undue risk." Neither company is publicly held.
13. Debt to equity ratio
Market ratios:
Note: Round your intermediate calculations and final answers to 2 decimal places. Enter percentage answers rounded to 2
decimal places (i.e. 0.1234 should be entered as 12.34).
14. Price earnings ratio
15. Dividend yield ratio
Blue Water
$ 41,000
38,000
99,000
140,000
84,000
$ 402,000
$99,000
65,000
148,000
29,000
61,000
$ 402,000
BLUE WATER
COMPANY
%
%
%
%
$ 447,000
(241,000)
(161,000)
$ 45,000
%
PRIME FISH
COMPANY
$ 22
30%
$ 33,000
%
%
%
%
%
Prime Fish
$ 21,000
31,000
40,000
401,000
305,000
$ 798,000
$ 49,000
60,000
512,000
106,000
71,000
$ 798,000
$ 802,000
(400,000)
(311,000)
$ 91,000
$ 15
30%
$ 148,000
Expert Solution
This question has been solved!
Explore an expertly crafted, step-by-step solution for a thorough understanding of key concepts.

This is a popular solution!

Trending now
This is a popular solution!

Step by step
Solved in 3 steps with 2 images

Knowledge Booster


Learn more about
Need a deep-dive on the concept behind this application? Look no further. Learn more about this topic, accounting and related others by exploring similar questions and additional content below.Recommended textbooks for you
College Accounting, Chapters 1-27 (New in Account…
Accounting
ISBN:
9781305666160
Author:
James A. Heintz, Robert W. Parry
Publisher:
Cengage Learning

Accounting
Accounting
ISBN:
9781337272094
Author:
WARREN, Carl S., Reeve, James M., Duchac, Jonathan E.
Publisher:
Cengage Learning,

Financial & Managerial Accounting
Accounting
ISBN:
9781285866307
Author:
Carl Warren, James M. Reeve, Jonathan Duchac
Publisher:
Cengage Learning
College Accounting, Chapters 1-27 (New in Account…
Accounting
ISBN:
9781305666160
Author:
James A. Heintz, Robert W. Parry
Publisher:
Cengage Learning
Accounting
Accounting
ISBN:
9781337272094
Author:
WARREN, Carl S., Reeve, James M., Duchac, Jonathan E.
Publisher:
Cengage Learning,
Financial & Managerial Accounting
Accounting
ISBN:
9781285866307
Author:
Carl Warren, James M. Reeve, Jonathan Duchac
Publisher:
Cengage Learning