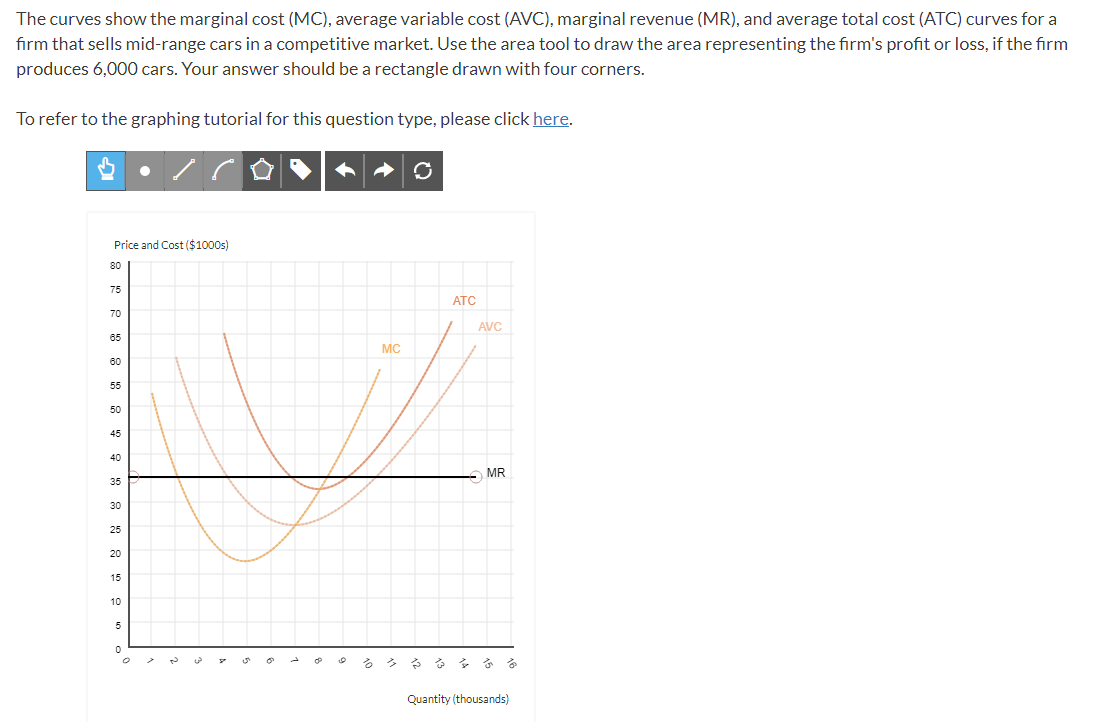
The curves show the marginal cost (MC), average variable cost (AVC), marginal revenue (MR), and average total cost (ATC) curves for a firm that sells mid-range cars in a competitive market. Use the area tool to draw the area representing the firm's profit or loss, if the firm produces 6,000 cars. Your answer should be a rectangle drawn with four corners. To refer to the graphing tutorial for this question type, please click here. Price and Cost ($1000s) 80 75 ATC 70 AVC 65 MC 60 55 50 45 40 MR 35 30 25 20 15 10 5 う る るる Quantity (thousands)
The curves show the marginal cost (MC), average variable cost (AVC), marginal revenue (MR), and average total cost (ATC) curves for a firm that sells mid-range cars in a competitive market. Use the area tool to draw the area representing the firm's profit or loss, if the firm produces 6,000 cars. Your answer should be a rectangle drawn with four corners. To refer to the graphing tutorial for this question type, please click here. Price and Cost ($1000s) 80 75 ATC 70 AVC 65 MC 60 55 50 45 40 MR 35 30 25 20 15 10 5 う る るる Quantity (thousands)

Managerial Economics: A Problem Solving Approach
5th Edition
ISBN:9781337106665
Author:Luke M. Froeb, Brian T. McCann, Michael R. Ward, Mike Shor
Publisher:Luke M. Froeb, Brian T. McCann, Michael R. Ward, Mike Shor
Chapter7: Economies Of Scale And Scope
Section: Chapter Questions
Problem 7.3IP

Related questions
Question
The
Transcribed Image Text:The curves show the marginal cost (MC), average variable cost (AVC), marginal revenue (MR), and average total cost (ATC) curves for a
firm that sells mid-range cars in a competitive market. Use the area tool to draw the area representing the firm's profit or loss, if the firm
produces 6,000 cars. Your answer should be a rectangle drawn with four corners.
To refer to the graphing tutorial for this question type, please click here.
Price and Cost ($1000s)
80
75
ATC
70
AVC
65
MC
60
55
50
45
40
MR
35
30
25
20
15
10
5
るう
Quantity (thousands)
Expert Solution
This question has been solved!
Explore an expertly crafted, step-by-step solution for a thorough understanding of key concepts.

This is a popular solution!

Trending now
This is a popular solution!

Step by step
Solved in 2 steps with 1 images

Knowledge Booster


Learn more about
Need a deep-dive on the concept behind this application? Look no further. Learn more about this topic, economics and related others by exploring similar questions and additional content below.Recommended textbooks for you
Managerial Economics: A Problem Solving Approach
Economics
ISBN:
9781337106665
Author:
Luke M. Froeb, Brian T. McCann, Michael R. Ward, Mike Shor
Publisher:
Cengage Learning


Managerial Economics: A Problem Solving Approach
Economics
ISBN:
9781337106665
Author:
Luke M. Froeb, Brian T. McCann, Michael R. Ward, Mike Shor
Publisher:
Cengage Learning

Economics (MindTap Course List)
Economics
ISBN:
9781337617383
Author:
Roger A. Arnold
Publisher:
Cengage Learning


Essentials of Economics (MindTap Course List)
Economics
ISBN:
9781337091992
Author:
N. Gregory Mankiw
Publisher:
Cengage Learning