The dat. Yits show the distance y (in meters) required to stop a train traveling at a speed x (in kilometers per hour). Each figure has the same data points. However, each figure has a different curve fitting the data. The equation for each curve is also shown. Answer the questions that follow. Figure 1 Figure 2 Figure 3 2500- 2500- 2500- 2000- 2000- 2000 1500 1500- I500 1000 500 _y = 0.12x² +1.1x+104.4 y = 1.5x-125.3x+2675 y = 0.28x² +2.25x |(a) Which curve fits the data best? O Figure 1 O Figure 2 O Figure 3 | (b) Use the equation of the best fitting curve from part (a) to predict the distance required to stop the train when it is travelling 50 kilometers per hour. Give an exact answer, not a rounded approximation. O meters
The dat. Yits show the distance y (in meters) required to stop a train traveling at a speed x (in kilometers per hour). Each figure has the same data points. However, each figure has a different curve fitting the data. The equation for each curve is also shown. Answer the questions that follow. Figure 1 Figure 2 Figure 3 2500- 2500- 2500- 2000- 2000- 2000 1500 1500- I500 1000 500 _y = 0.12x² +1.1x+104.4 y = 1.5x-125.3x+2675 y = 0.28x² +2.25x |(a) Which curve fits the data best? O Figure 1 O Figure 2 O Figure 3 | (b) Use the equation of the best fitting curve from part (a) to predict the distance required to stop the train when it is travelling 50 kilometers per hour. Give an exact answer, not a rounded approximation. O meters

Trigonometry (MindTap Course List)
8th Edition
ISBN:9781305652224
Author:Charles P. McKeague, Mark D. Turner
Publisher:Charles P. McKeague, Mark D. Turner
Chapter4: Graphing And Inverse Functions
Section4.5: Finding An Equation From Lts Graph
Problem 58PS

Related questions

Question
Help please
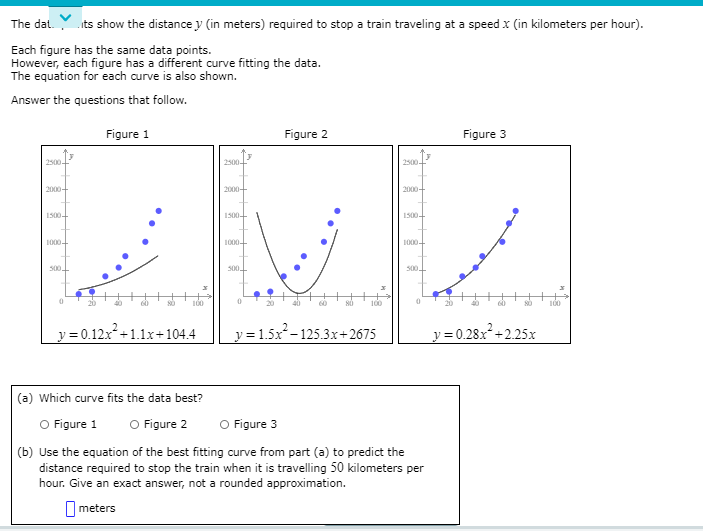
Transcribed Image Text:The dat. Yits show the distance y (in meters) required to stop a train traveling at a speed x (in kilometers per hour).
Each figure has the same data points.
However, each figure has a different curve fitting the data.
The equation for each curve is also shown.
Answer the questions that follow.
Figure 1
Figure 2
Figure 3
2500-
25004
2500-
2000-
2000+
2000+
1500-
1500-
1500-
1000-
1000-
1000-
500
500
500
40
NO
100
60
100
80
100
y = 0.12x+1.1x+104.4
y = 1.5x-125.3x+2675
y = 0.28x+2.25x
(a) Which curve fits the data best?
O Figure 1
O Figure 2
O Figure 3
(b) Use the equation of the best fitting curve from part (a) to predict the
distance required to stop the train when it is travelling 50 kilometers per
hour. Give an exact answer, not a rounded approximation.
O meters
Expert Solution
This question has been solved!
Explore an expertly crafted, step-by-step solution for a thorough understanding of key concepts.

This is a popular solution!

Trending now
This is a popular solution!

Step by step
Solved in 2 steps

Knowledge Booster


Learn more about
Need a deep-dive on the concept behind this application? Look no further. Learn more about this topic, algebra and related others by exploring similar questions and additional content below.Recommended textbooks for you
Trigonometry (MindTap Course List)
Trigonometry
ISBN:
9781305652224
Author:
Charles P. McKeague, Mark D. Turner
Publisher:
Cengage Learning

Algebra & Trigonometry with Analytic Geometry
Algebra
ISBN:
9781133382119
Author:
Swokowski
Publisher:
Cengage

Algebra: Structure And Method, Book 1
Algebra
ISBN:
9780395977224
Author:
Richard G. Brown, Mary P. Dolciani, Robert H. Sorgenfrey, William L. Cole
Publisher:
McDougal Littell
Trigonometry (MindTap Course List)
Trigonometry
ISBN:
9781305652224
Author:
Charles P. McKeague, Mark D. Turner
Publisher:
Cengage Learning
Algebra & Trigonometry with Analytic Geometry
Algebra
ISBN:
9781133382119
Author:
Swokowski
Publisher:
Cengage
Algebra: Structure And Method, Book 1
Algebra
ISBN:
9780395977224
Author:
Richard G. Brown, Mary P. Dolciani, Robert H. Sorgenfrey, William L. Cole
Publisher:
McDougal Littell

Mathematics For Machine Technology
Advanced Math
ISBN:
9781337798310
Author:
Peterson, John.
Publisher:
Cengage Learning,

Holt Mcdougal Larson Pre-algebra: Student Edition…
Algebra
ISBN:
9780547587776
Author:
HOLT MCDOUGAL
Publisher:
HOLT MCDOUGAL