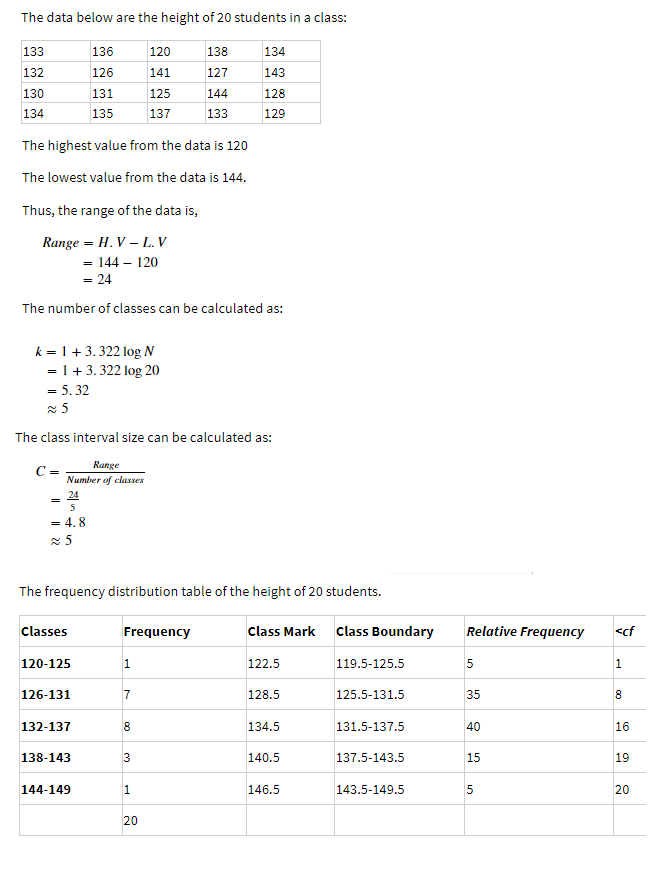
The data below are the height of 20 students in a class: 133 136 120 138 134 132 126 141 127 143 130 131 125 144 128 134 135 137 133 129 The highest value from the data is 120 The lowest value from the data is 144. Thus, the range of the data is, Range = H. V – L. V = 144 – 120 = 24 The number of classes can be calculated as: k = 1+ 3.322 log N -1+3. 322 log 20 = 5. 32 The class interval size can be calculated as: C = Range Number of classes 5 = 4. 8 The frequency distribution table of the height of 20 students. Classes Frequency Class Mark Class Boundary Relative Frequency
The data below are the height of 20 students in a class: 133 136 120 138 134 132 126 141 127 143 130 131 125 144 128 134 135 137 133 129 The highest value from the data is 120 The lowest value from the data is 144. Thus, the range of the data is, Range = H. V – L. V = 144 – 120 = 24 The number of classes can be calculated as: k = 1+ 3.322 log N -1+3. 322 log 20 = 5. 32 The class interval size can be calculated as: C = Range Number of classes 5 = 4. 8 The frequency distribution table of the height of 20 students. Classes Frequency Class Mark Class Boundary Relative Frequency

Glencoe Algebra 1, Student Edition, 9780079039897, 0079039898, 2018
18th Edition
ISBN:9780079039897
Author:Carter
Publisher:Carter
Chapter10: Statistics
Section10.2: Representing Data
Problem 24PFA

Related questions
Question
Construct a histogram for the class boundaries.
Transcribed Image Text:The data below are the height of 20 students in a class:
133
136
120
138
134
132
126
141
127
143
130
131
125
144
128
134
135
137
133
129
The highest value from the data is 120
The lowest value from the data is 144.
Thus, the range of the data is,
Range = H. V - L. V
= 144 – 120
= 24
The number of classes can be calculated as:
k = 1+3. 322 log N
= 1 + 3. 322 log 20
= 5. 32
The class interval size can be calculate
as:
Range
Number of classes
24
5
= 4.8
The frequency distribution table of the height of 20 students.
Classes
Frequency
Class Mark
Class Boundary
Relative Frequency
<cf
120-125
1.
122.5
119.5-125.5
1
126-131
7
128.5
125.5-131.5
35
8
132-137
8
134.5
131.5-137.5
40
16
138-143
3
140.5
137.5-143.5
15
19
144-149
1.
146.5
143.5-149.5
5
20
20
Expert Solution
This question has been solved!
Explore an expertly crafted, step-by-step solution for a thorough understanding of key concepts.

Step by step
Solved in 3 steps with 3 images

Recommended textbooks for you
Glencoe Algebra 1, Student Edition, 9780079039897…
Algebra
ISBN:
9780079039897
Author:
Carter
Publisher:
McGraw Hill

Algebra: Structure And Method, Book 1
Algebra
ISBN:
9780395977224
Author:
Richard G. Brown, Mary P. Dolciani, Robert H. Sorgenfrey, William L. Cole
Publisher:
McDougal Littell
Glencoe Algebra 1, Student Edition, 9780079039897…
Algebra
ISBN:
9780079039897
Author:
Carter
Publisher:
McGraw Hill
Algebra: Structure And Method, Book 1
Algebra
ISBN:
9780395977224
Author:
Richard G. Brown, Mary P. Dolciani, Robert H. Sorgenfrey, William L. Cole
Publisher:
McDougal Littell