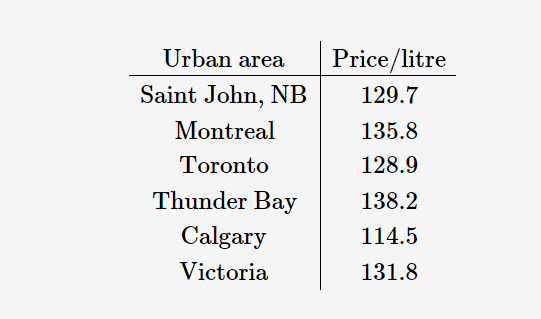
The data below gives the mean price (in cents) of a litre of regular gasoline at self-service filling stations at a sample of six urban centres in Canada in May 2012.


The data below gives the
Part (c) Using the appropriate t distribution, find a 90% confidence interval for the mean gasoline price per litre across urban Canada in May 2012. Provide the upper and lower bounds for your confidence interval. ( , )
Part (d) Would a 95% confidence interval be wider or narrower than the interval you found in Part (c)? Using the appropriate t distribution, find a 95% confidence interval for the mean gasoline price per litre across urban Canada in May 2012. Provide the upper and lower bounds for your confidence interval. ( , )


Trending now
This is a popular solution!

Step by step
Solved in 4 steps with 3 images
