The data below show the weights of 14 different dogs that visited a veterinarian on one day. Calculate the 29th and 52nd percentiles of the data. 81 45 18 37 90 71 109 53 56 75 35 36 84 11 P29 This means that approximately 29 % of the data lie at or below when the data are ranked. P52 when the data are V o % of the data lie at or below This means that approximately 52 ranked. Question Help: Read Submit Question 72°F Clear hp
The data below show the weights of 14 different dogs that visited a veterinarian on one day. Calculate the 29th and 52nd percentiles of the data. 81 45 18 37 90 71 109 53 56 75 35 36 84 11 P29 This means that approximately 29 % of the data lie at or below when the data are ranked. P52 when the data are V o % of the data lie at or below This means that approximately 52 ranked. Question Help: Read Submit Question 72°F Clear hp

Glencoe Algebra 1, Student Edition, 9780079039897, 0079039898, 2018
18th Edition
ISBN:9780079039897
Author:Carter
Publisher:Carter
Chapter10: Statistics
Section10.5: Comparing Sets Of Data
Problem 14PPS

Related questions
Question
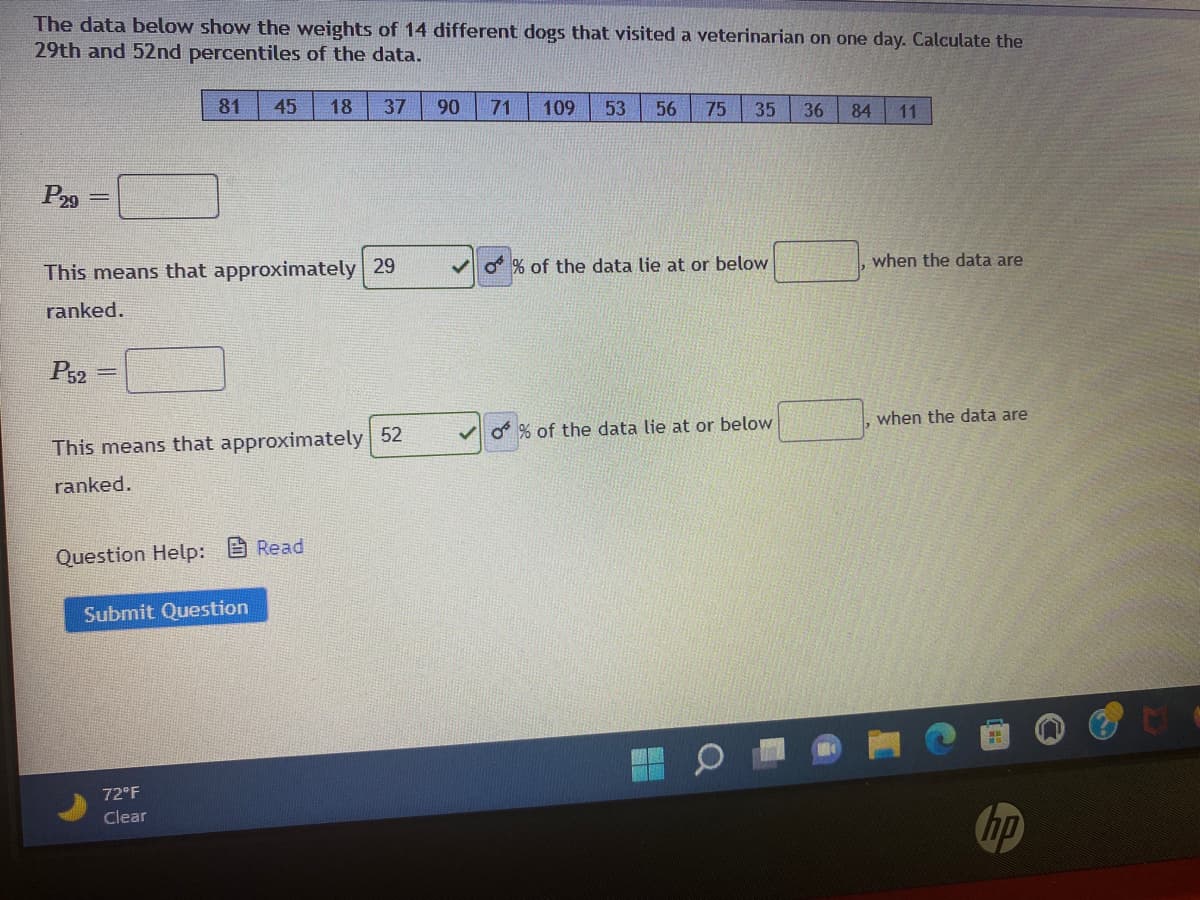
Transcribed Image Text:The data below show the weights of 14 different dogs that visited a veterinarian on one day. Calculate the
29th and 52nd percentiles of the data.
81
45
18
37
90
71
109
53
56
75
35
36
84
11
P29
This means that approximately 29
% of the data lie at or below
when the data are
ranked.
P52
when the data are
V O % of the data lie at or below
This means that approximately 52
ranked.
Question Help: Read
Submit Question
72°F
Clear
hp
Expert Solution
This question has been solved!
Explore an expertly crafted, step-by-step solution for a thorough understanding of key concepts.

This is a popular solution!

Trending now
This is a popular solution!

Step by step
Solved in 2 steps with 2 images

Recommended textbooks for you
Glencoe Algebra 1, Student Edition, 9780079039897…
Algebra
ISBN:
9780079039897
Author:
Carter
Publisher:
McGraw Hill
Glencoe Algebra 1, Student Edition, 9780079039897…
Algebra
ISBN:
9780079039897
Author:
Carter
Publisher:
McGraw Hill