The owner of a chain of mini-markets wants to compare the sales performance of two of her stores, Store 1 and Store 2. Though the two stores have been comparable in the past, the owner has made several improvements to Store 1 and wishes to see if the improvements have made Store 1 more popular than Store 2. Sales can vary considerably depending on the day of the week and the season of the year, so she decides to eliminate such effects by making sure to record each store's sales on the same 10 days, chosen at random. She records the sales (in dollars) for each store on these days, as shown in the table below. 8 9 10 Day 1 2 3 4 6 7 Store 1 462 390 848 621 524 450 807 628 914 713 Store 2 405 259 846 421 387 417 638 672 865 390 Difference 57 (Store 1- Store 2) 131 2 200 137 33 169 -44 49 323 Send data to calculator Based on these data, can the owner conclude, at the 0.10 level of significance, that the mean daily sales of Store 1 exceeds that of Store 2? Answer this question by performing a hypothesis test regarding , (which is u with a letter "d" subscript), the population mean daily sales difference between the two stores. Assume that this population of differences (Store 1 minus Store 2) is normally distributed. Perform a one-tailed test. Then complete the parts below. Carry your intermediate computations to three or more decimal places and round your answers as specified. (If necessary, consult a list of formulas.)
The owner of a chain of mini-markets wants to compare the sales performance of two of her stores, Store 1 and Store 2. Though the two stores have been comparable in the past, the owner has made several improvements to Store 1 and wishes to see if the improvements have made Store 1 more popular than Store 2. Sales can vary considerably depending on the day of the week and the season of the year, so she decides to eliminate such effects by making sure to record each store's sales on the same 10 days, chosen at random. She records the sales (in dollars) for each store on these days, as shown in the table below. 8 9 10 Day 1 2 3 4 6 7 Store 1 462 390 848 621 524 450 807 628 914 713 Store 2 405 259 846 421 387 417 638 672 865 390 Difference 57 (Store 1- Store 2) 131 2 200 137 33 169 -44 49 323 Send data to calculator Based on these data, can the owner conclude, at the 0.10 level of significance, that the mean daily sales of Store 1 exceeds that of Store 2? Answer this question by performing a hypothesis test regarding , (which is u with a letter "d" subscript), the population mean daily sales difference between the two stores. Assume that this population of differences (Store 1 minus Store 2) is normally distributed. Perform a one-tailed test. Then complete the parts below. Carry your intermediate computations to three or more decimal places and round your answers as specified. (If necessary, consult a list of formulas.)

MATLAB: An Introduction with Applications
6th Edition
ISBN:9781119256830
Author:Amos Gilat
Publisher:Amos Gilat
Chapter1: Starting With Matlab
Section: Chapter Questions
Problem 1P

Related questions
Question
state the degrees of freedom if necessary
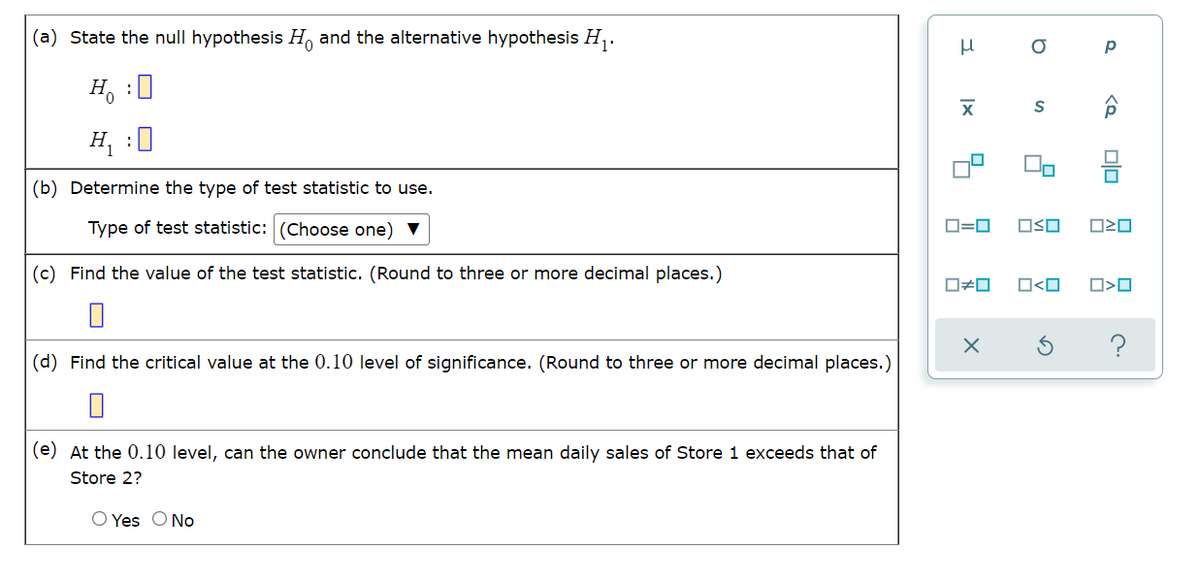
Transcribed Image Text:(a) State the null hypothesis H, and the alternative hypothesis H .
H :U
H, :0
|(b) Determine the type of test statistic to use.
Type of test statistic: (Choose one) V
D=0
OSO
|(c) Find the value of the test statistic. (Round to three or more decimal places.)
O<O
O>O
(d) Find the critical value at the 0.10 level of significance. (Round to three or more decimal places.)
(e) At the 0.10 level, can the owner conclude that the mean daily sales of Store 1 exceeds that of
Store 2?
O Yes O No
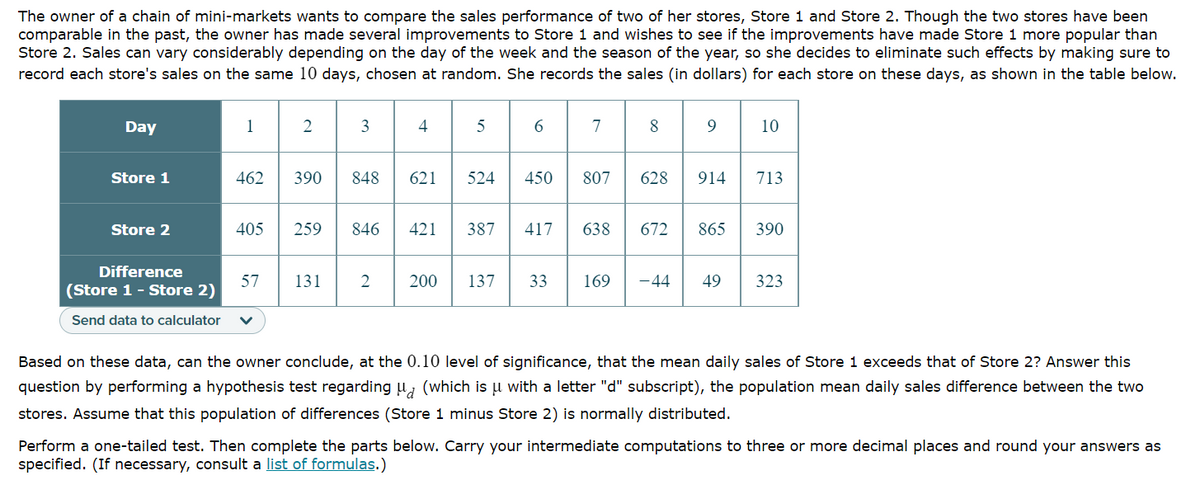
Transcribed Image Text:The owner of a chain of mini-markets wants to compare the sales performance of two of her stores, Store 1 and Store 2. Though the two stores have been
comparable in the past, the owner has made several improvements to Store 1 and wishes to see if the improvements have made Store 1 more popular than
Store 2. Sales can vary considerably depending on the day of the week and the season of the year, so she decides to eliminate such effects by making sure to
record each store's sales on the same 10 days, chosen at random. She records the sales (in dollars) for each store on these days, as shown in the table below.
Day
1
4
6
7
10
Store 1
462
390
848
621
524
450
807
628
914
713
Store 2
405
259
846
421
387
417
638
672
865
390
Difference
57
131
200
137
33
169
-44
49
323
(Store 1- Store 2)
Send data to calculator
Based on these data, can the owner conclude, at the 0.10 level of significance, that the mean daily sales of Store 1 exceeds that of Store 2? Answer this
question by performing a hypothesis test regarding u, (which is u with a letter "d" subscript), the population mean daily sales difference between the two
stores. Assume that this population of differences (Store 1 minus Store 2) is normally distributed.
Perform a one-tailed test. Then complete the parts below. Carry your intermediate computations to three or more decimal places and round your answers as
specified. (If necessary, consult a list of formulas.)
3.
Expert Solution
This question has been solved!
Explore an expertly crafted, step-by-step solution for a thorough understanding of key concepts.

Step by step
Solved in 3 steps with 3 images

Recommended textbooks for you
MATLAB: An Introduction with Applications
Statistics
ISBN:
9781119256830
Author:
Amos Gilat
Publisher:
John Wiley & Sons Inc

Probability and Statistics for Engineering and th…
Statistics
ISBN:
9781305251809
Author:
Jay L. Devore
Publisher:
Cengage Learning

Statistics for The Behavioral Sciences (MindTap C…
Statistics
ISBN:
9781305504912
Author:
Frederick J Gravetter, Larry B. Wallnau
Publisher:
Cengage Learning
MATLAB: An Introduction with Applications
Statistics
ISBN:
9781119256830
Author:
Amos Gilat
Publisher:
John Wiley & Sons Inc
Probability and Statistics for Engineering and th…
Statistics
ISBN:
9781305251809
Author:
Jay L. Devore
Publisher:
Cengage Learning
Statistics for The Behavioral Sciences (MindTap C…
Statistics
ISBN:
9781305504912
Author:
Frederick J Gravetter, Larry B. Wallnau
Publisher:
Cengage Learning

Elementary Statistics: Picturing the World (7th E…
Statistics
ISBN:
9780134683416
Author:
Ron Larson, Betsy Farber
Publisher:
PEARSON

The Basic Practice of Statistics
Statistics
ISBN:
9781319042578
Author:
David S. Moore, William I. Notz, Michael A. Fligner
Publisher:
W. H. Freeman

Introduction to the Practice of Statistics
Statistics
ISBN:
9781319013387
Author:
David S. Moore, George P. McCabe, Bruce A. Craig
Publisher:
W. H. Freeman