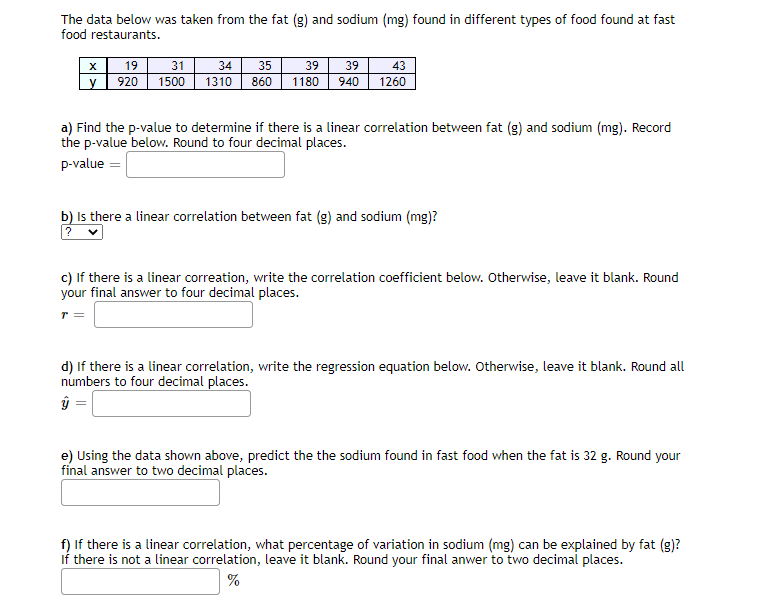
The data below was taken from the fat (g) and sodium (mg) found in different types of food found at fast food restaurants. 39 39 1180 940 1260 19 31 34 35 43 y 920 1500 1310 860 a) Find the p-value to determine if there is a linear correlation between fat (g) and sodium (mg). Record the p-value below. Round to four decimal places. p-value = b) Is there a linear correlation between fat (g) and sodium (mg)? c) If there is a linear correation, write the correlation coefficient below. Otherwise, leave it blank. Round your final answer to four decimal places. d) If there is a linear correlation, write the regression equation below. Otherwise, leave it blank. Round all numbers to four decimal places. e) Using the data shown above, predict the the sodium found in fast food when the fat is 32 g. Round your final answer to two decimal places. f) If there is a linear correlation, what percentage of variation in sodium (mg) can be explained by fat (g)? If there is not a linear correlation, leave it blank. Round your final anwer to two decimal places.


Inverse Normal Distribution
The method used for finding the corresponding z-critical value in a normal distribution using the known probability is said to be an inverse normal distribution. The inverse normal distribution is a continuous probability distribution with a family of two parameters.
Mean, Median, Mode
It is a descriptive summary of a data set. It can be defined by using some of the measures. The central tendencies do not provide information regarding individual data from the dataset. However, they give a summary of the data set. The central tendency or measure of central tendency is a central or typical value for a probability distribution.
Z-Scores
A z-score is a unit of measurement used in statistics to describe the position of a raw score in terms of its distance from the mean, measured with reference to standard deviation from the mean. Z-scores are useful in statistics because they allow comparison between two scores that belong to different normal distributions.


Trending now
This is a popular solution!

Step by step
Solved in 2 steps with 2 images


