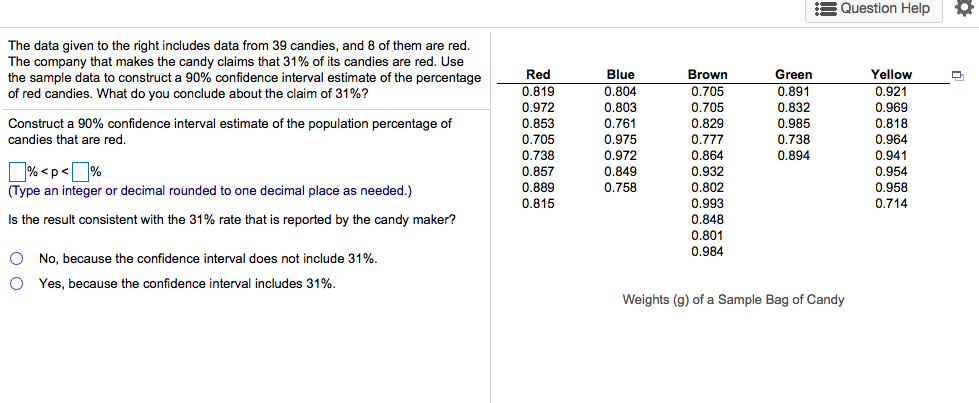
The data given to the right includes data from 39 candies, and 8 of them are red. The company that makes the candy claims that 31% of its candies are red. Use the sample data to construct a 90% confidence interval estimate of the percentage of red candies. What do you conclude about the claim of 31%? Blue 0.804 Yellow Red 0.819 0.972 0.853 Brown Green 0.705 0.891 0.832 0.985 0.738 0.894 0.921 0.803 0.705 0.969 Construct a 90% confidence interval estimate of the population percentage of candies that are red. 0.761 0.829 0.818 0.705 0.975 0.777 0.964 0.738 0.857 0.889 0.815 0.972 0.849 0.758 0.864 0.941 %


Inverse Normal Distribution
The method used for finding the corresponding z-critical value in a normal distribution using the known probability is said to be an inverse normal distribution. The inverse normal distribution is a continuous probability distribution with a family of two parameters.
Mean, Median, Mode
It is a descriptive summary of a data set. It can be defined by using some of the measures. The central tendencies do not provide information regarding individual data from the dataset. However, they give a summary of the data set. The central tendency or measure of central tendency is a central or typical value for a probability distribution.
Z-Scores
A z-score is a unit of measurement used in statistics to describe the position of a raw score in terms of its distance from the mean, measured with reference to standard deviation from the mean. Z-scores are useful in statistics because they allow comparison between two scores that belong to different normal distributions.


Trending now
This is a popular solution!

Step by step
Solved in 2 steps


