The data in the table represent the ages of the winners of an award for the past five years. Use the data to answer questions (a) through (e). 48 26 45 45 63 (a) Compute the population mean, µ. H= 45.4 (b) Compute the mean for all 5C, = 10 samples with size n= 2. Sample Sample Mean Sample Sample Mean 48,26 26,45 48,45 26,63 48,45 45,45 48,63 45,63 26,45 45,63 OOOOD
The data in the table represent the ages of the winners of an award for the past five years. Use the data to answer questions (a) through (e). 48 26 45 45 63 (a) Compute the population mean, µ. H= 45.4 (b) Compute the mean for all 5C, = 10 samples with size n= 2. Sample Sample Mean Sample Sample Mean 48,26 26,45 48,45 26,63 48,45 45,45 48,63 45,63 26,45 45,63 OOOOD

Glencoe Algebra 1, Student Edition, 9780079039897, 0079039898, 2018
18th Edition
ISBN:9780079039897
Author:Carter
Publisher:Carter
Chapter10: Statistics
Section10.5: Comparing Sets Of Data
Problem 13PPS

Related questions
Question
|
The data in the table represent the ages of the winners of an award for the past five years. Use the data to answer questions (a) through (e).
|
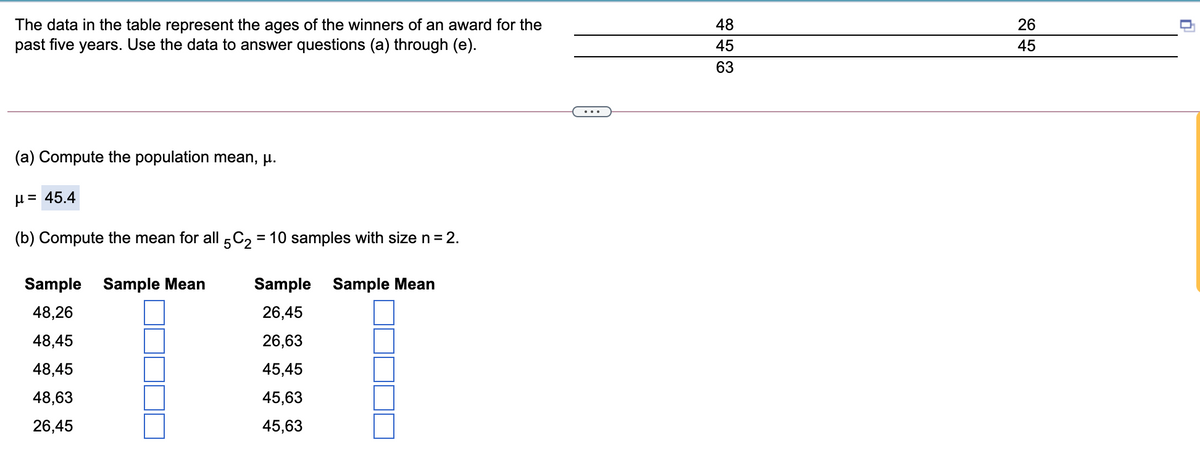
Transcribed Image Text:The data in the table represent the ages of the winners of an award for the
past five years. Use the data to answer questions (a) through (e).
48
26
45
45
63
...
(a) Compute the population mean, µ.
H = 45.4
(b) Compute the mean for all5C2 = 10 samples with size n= 2.
Sample Sample Mean
Sample Sample Mean
48,26
26,45
48,45
26,63
48,45
45,45
48,63
45,63
26,45
45,63
Expert Solution
This question has been solved!
Explore an expertly crafted, step-by-step solution for a thorough understanding of key concepts.

This is a popular solution!

Trending now
This is a popular solution!

Step by step
Solved in 2 steps with 1 images

Recommended textbooks for you
Glencoe Algebra 1, Student Edition, 9780079039897…
Algebra
ISBN:
9780079039897
Author:
Carter
Publisher:
McGraw Hill
Glencoe Algebra 1, Student Edition, 9780079039897…
Algebra
ISBN:
9780079039897
Author:
Carter
Publisher:
McGraw Hill