Estimate the production for the years 2008 and 2010 with the help of the following table : Year Production Year Production (in '000 tonnes) (in '000 tonnes) 2005 200 Yo 2009 350 Y4 2006 220 2010 ? Y5 2007 260 Y2 2011 430 2008 ? Уз
Estimate the production for the years 2008 and 2010 with the help of the following table : Year Production Year Production (in '000 tonnes) (in '000 tonnes) 2005 200 Yo 2009 350 Y4 2006 220 2010 ? Y5 2007 260 Y2 2011 430 2008 ? Уз

MATLAB: An Introduction with Applications
6th Edition
ISBN:9781119256830
Author:Amos Gilat
Publisher:Amos Gilat
Chapter1: Starting With Matlab
Section: Chapter Questions
Problem 1P

Related questions
Question
GIVE CORRECT ANSWER
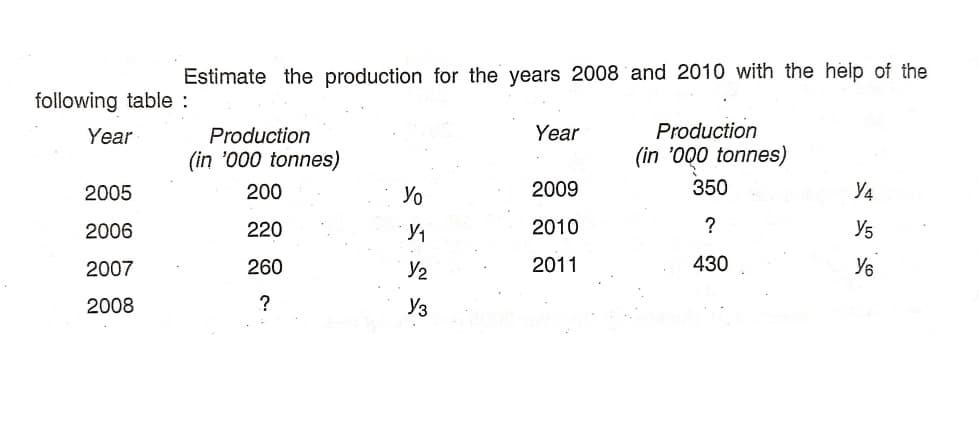
Transcribed Image Text:Estimate the production for the years 2008 and 2010 with the help of the
following table :
Year
Production
Year
Production
(in '000 tonnes)
(in '000 tonnes)
2005
200
Yo
2009
350
Y4
2006
220
2010
Y5
2007
260
Y2
2011
430
Y6
2008
?
Уз
Expert Solution
This question has been solved!
Explore an expertly crafted, step-by-step solution for a thorough understanding of key concepts.

Step by step
Solved in 2 steps with 1 images

Recommended textbooks for you
MATLAB: An Introduction with Applications
Statistics
ISBN:
9781119256830
Author:
Amos Gilat
Publisher:
John Wiley & Sons Inc

Probability and Statistics for Engineering and th…
Statistics
ISBN:
9781305251809
Author:
Jay L. Devore
Publisher:
Cengage Learning

Statistics for The Behavioral Sciences (MindTap C…
Statistics
ISBN:
9781305504912
Author:
Frederick J Gravetter, Larry B. Wallnau
Publisher:
Cengage Learning
MATLAB: An Introduction with Applications
Statistics
ISBN:
9781119256830
Author:
Amos Gilat
Publisher:
John Wiley & Sons Inc
Probability and Statistics for Engineering and th…
Statistics
ISBN:
9781305251809
Author:
Jay L. Devore
Publisher:
Cengage Learning
Statistics for The Behavioral Sciences (MindTap C…
Statistics
ISBN:
9781305504912
Author:
Frederick J Gravetter, Larry B. Wallnau
Publisher:
Cengage Learning

Elementary Statistics: Picturing the World (7th E…
Statistics
ISBN:
9780134683416
Author:
Ron Larson, Betsy Farber
Publisher:
PEARSON

The Basic Practice of Statistics
Statistics
ISBN:
9781319042578
Author:
David S. Moore, William I. Notz, Michael A. Fligner
Publisher:
W. H. Freeman

Introduction to the Practice of Statistics
Statistics
ISBN:
9781319013387
Author:
David S. Moore, George P. McCabe, Bruce A. Craig
Publisher:
W. H. Freeman