The data in the table represent the training times (in seconds) for Adam and Miguel. Adam 103 105 104 106 100 98 92 91 97 101 Miguel 88 86 89 93 105 85 92 96 97 94 (a) All of the training times of which person had the greatest spread? Explain how you know. (b) The middle 50% of the training times of which person had the least spread? Explain how you know. (c) What do the answers to Parts 2(a) and 2(b) tell you about Adam's and Miguel's training times?
The data in the table represent the training times (in seconds) for Adam and Miguel. Adam 103 105 104 106 100 98 92 91 97 101 Miguel 88 86 89 93 105 85 92 96 97 94 (a) All of the training times of which person had the greatest spread? Explain how you know. (b) The middle 50% of the training times of which person had the least spread? Explain how you know. (c) What do the answers to Parts 2(a) and 2(b) tell you about Adam's and Miguel's training times?

Holt Mcdougal Larson Pre-algebra: Student Edition 2012
1st Edition
ISBN:9780547587776
Author:HOLT MCDOUGAL
Publisher:HOLT MCDOUGAL
Chapter11: Data Analysis And Probability
Section: Chapter Questions
Problem 6CST

Related questions
Question
Can you help me with this math problem you can see it in this picture.
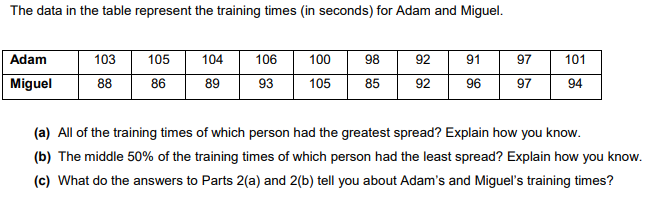
Transcribed Image Text:The data in the table represent the training times (in seconds) for Adam and Miguel.
Adam
103
105
104
106
100
98
92
91
97
101
Miguel
88
89
93
105
85
92
96
97
94
(a) All of the training times of which person had the greatest spread? Explain how you know.
(b) The middle 50% of the training times of which person had the least spread? Explain how you know.
(c) What do the answers to Parts 2(a) and 2(b) tell you about Adam's and Miguel's training times?
Expert Solution
This question has been solved!
Explore an expertly crafted, step-by-step solution for a thorough understanding of key concepts.

This is a popular solution!

Trending now
This is a popular solution!

Step by step
Solved in 2 steps

Knowledge Booster


Learn more about
Need a deep-dive on the concept behind this application? Look no further. Learn more about this topic, advanced-math and related others by exploring similar questions and additional content below.Recommended textbooks for you
Holt Mcdougal Larson Pre-algebra: Student Edition…
Algebra
ISBN:
9780547587776
Author:
HOLT MCDOUGAL
Publisher:
HOLT MCDOUGAL
Holt Mcdougal Larson Pre-algebra: Student Edition…
Algebra
ISBN:
9780547587776
Author:
HOLT MCDOUGAL
Publisher:
HOLT MCDOUGAL