The table below shows the study time and test scores for a number of students. Study Time(min) 10 15 18 25 35 41 50 Test Score 61 72 74 81 89 90 95 A) Draw a scatterplot that is suitable for predicting test scores based on study
The table below shows the study time and test scores for a number of students. Study Time(min) 10 15 18 25 35 41 50 Test Score 61 72 74 81 89 90 95 A) Draw a scatterplot that is suitable for predicting test scores based on study

Chapter6: Exponential And Logarithmic Functions
Section6.8: Fitting Exponential Models To Data
Problem 3TI: Table 6 shows the population, in thousands, of harbor seals in the Wadden Sea over the years 1997 to...

Related questions
Question
I will give a helpful like to anyone who can answer theses. Happy new year. Love you
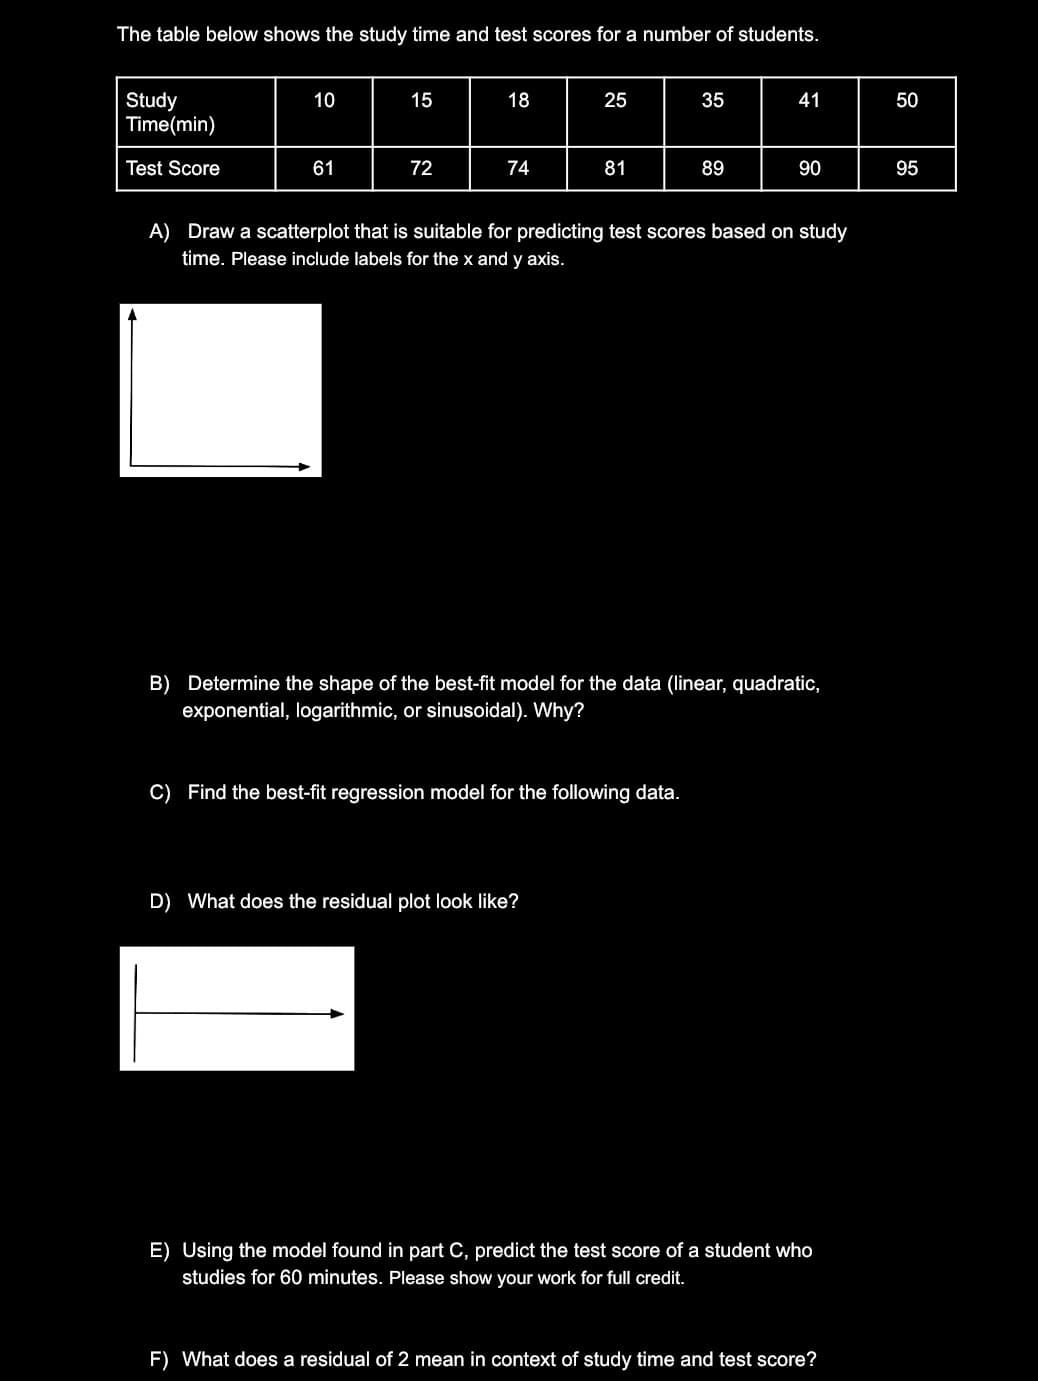
Transcribed Image Text:The table below shows the study time and test scores for a number of students.
Study
Time(min)
10
15
18
25
35
41
50
Test Score
61
72
74
81
89
90
95
A) Draw a scatterplot that is suitable for predicting test scores based on study
time. Please include labels for the x and y axis.
B) Determine the shape of the best-fit model for the data (linear, quadratic,
exponential, logarithmic, or sinusoidal). Why?
C) Find the best-fit regression model for the following data.
D) What does the residual plot look like?
E) Using the model found in part C, predict the test score of a student who
studies for 60 minutes. Please show your work for full credit.
F) What does a residual of 2 mean in context of study time and test score?
Expert Solution
This question has been solved!
Explore an expertly crafted, step-by-step solution for a thorough understanding of key concepts.

This is a popular solution!

Trending now
This is a popular solution!

Step by step
Solved in 2 steps with 1 images

Recommended textbooks for you

Linear Algebra: A Modern Introduction
Algebra
ISBN:
9781285463247
Author:
David Poole
Publisher:
Cengage Learning

Algebra & Trigonometry with Analytic Geometry
Algebra
ISBN:
9781133382119
Author:
Swokowski
Publisher:
Cengage
Linear Algebra: A Modern Introduction
Algebra
ISBN:
9781285463247
Author:
David Poole
Publisher:
Cengage Learning
Algebra & Trigonometry with Analytic Geometry
Algebra
ISBN:
9781133382119
Author:
Swokowski
Publisher:
Cengage

Glencoe Algebra 1, Student Edition, 9780079039897…
Algebra
ISBN:
9780079039897
Author:
Carter
Publisher:
McGraw Hill