The data in the table to the right are based on the results of a survey comparing the commute time of adults to their score on a well-being test. Complete parts (a) through (d) below. Click the icon to view the critical values for the correlation coefficient. …... (Round to three decimal places as needed.) Commute Time (in minutes) 4 13 13455 24 33 47 65 97 (c) Determine the linear correlation coefficient between commute time and well-being score. Well-Being Score 69.4 68.4 67.3 67.1 66.5 65.6 63.6
The data in the table to the right are based on the results of a survey comparing the commute time of adults to their score on a well-being test. Complete parts (a) through (d) below. Click the icon to view the critical values for the correlation coefficient. …... (Round to three decimal places as needed.) Commute Time (in minutes) 4 13 13455 24 33 47 65 97 (c) Determine the linear correlation coefficient between commute time and well-being score. Well-Being Score 69.4 68.4 67.3 67.1 66.5 65.6 63.6

Chapter4: Linear Functions
Section: Chapter Questions
Problem 30PT: For the following exercises, use Table 4 which shows the percent of unemployed persons 25 years or...

Related questions
Question
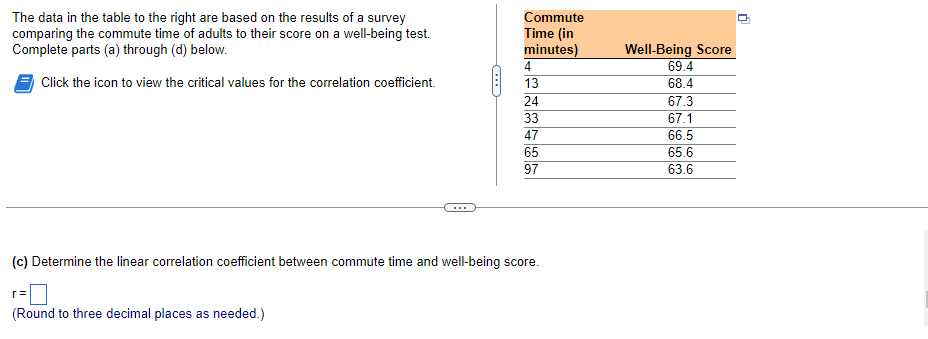
Transcribed Image Text:The data in the table to the right are based on the results of a survey
comparing the commute time of adults to their score on a well-being test.
Complete parts (a) through (d) below.
Click the icon to view the critical values for the correlation coefficient.
C
(Round to three decimal places as needed.)
Commute
Time (in
minutes)
4
13
24
33
47
65
kala
97
(c) Determine the linear correlation coefficient between commute time and well-being score.
Well-Being Score
69.4
68.4
67.3
67.1
66.5
65.6
63.6
n
Expert Solution
This question has been solved!
Explore an expertly crafted, step-by-step solution for a thorough understanding of key concepts.

Step by step
Solved in 3 steps with 2 images

Recommended textbooks for you

Glencoe Algebra 1, Student Edition, 9780079039897…
Algebra
ISBN:
9780079039897
Author:
Carter
Publisher:
McGraw Hill
Glencoe Algebra 1, Student Edition, 9780079039897…
Algebra
ISBN:
9780079039897
Author:
Carter
Publisher:
McGraw Hill