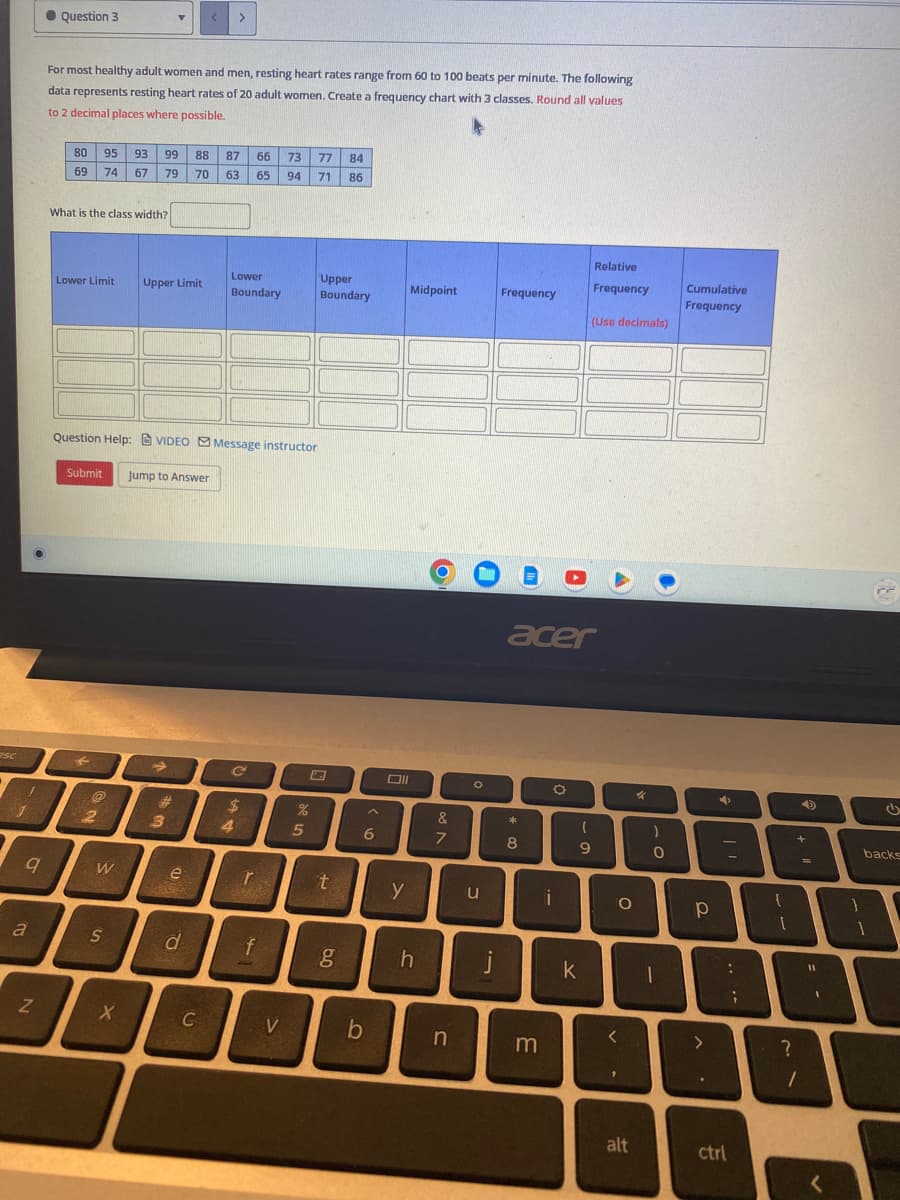
For most healthy adult women and men, resting heart rates range from 60 to 100 beats per minute. The following data represents resting heart rates of 20 adult women. Create a frequency chart with 3 classes. Round all values to 2 decimal places where possible.
Q: A CBS News poll conducted June 10 and 11, 2006, among a nationwide random sample of 651 adults,…
A: Answer:- Given data table is, better same worse Total Republican 38 104 44 186 Democrat…
Q: The r code for side by side boxplot of vitamind v newage and vitamin d v country. Scatterplot code…
A: The data frame is named "Data" and the variables in it are Country, Sun_Exposure, Gender, NewAge,…
Q: The Acme Company manufactures widgets. The distribution of widget weights is bell-shaped. The widget…
A: (a) The values of the widgets that the 95% of the distribution lies is obtained below as follows:…
Q: How closely does the mean of means match the population mean? How is the standard deviation of the…
A: Mean is the average of all the observations in the data set. It is a single value that represents…
Q: The test statistic of z = 2.61 is obtained when testing the claim that p = 0.709. a. Identify the…
A: The question is about hypo. testingGiven :Claim : p ≠ 0.709z test stat = 2.61Level of signif. ( ) =…
Q: what is the probability that her omelet will contain at least one Salmonella contaminated egg?
A: Linda hears a story on National Public Radio stating that one in six eggs in the United States are…
Q: What percent of the data is below 130? What percent of the data is above 150.8? What percent of…
A: Given that,To find the following percentages.
Q: Based on historical data, your manager believes that 29% of the company's orders come from…
A: The question is about sampling dist. of sample prop.Given :Popl. prop. of company's order come from…
Q: how do you determine part e?
A: Refer to part (a) x0.71.42.12.8Totalf(x)0.250.250.250.251It is 3:00 pm and service technicians…
Q: 1) Nicki made a tetrahedral die using a card and then tested to it to see whether it was fair. S
A: Claim : Die was fair ScoreFrequencies112215319422
Q: 7. Suppose the company's claim was different that the one above. Suppose they claimed that 20% of…
A: The null hypothesis assumes that the observed data fits the model proposed by the company, which…
Q: Suppose one has $1 now, and wants to win an additional dollars, where N~ Poisson(A). He tosses a…
A: Title: Analysis of a Stochastic Game: Winning Dollars with a Fair CoinIntroduction:In this problem,…
Q: The sport of Professional Bull Riders (PBR) is a world-wide phenomenon where riders mount a bull…
A: The provided observations for the average buckoff time are: 45.51, 44.09, 42.67, 44.7, 45.13.The…
Q: A random variable y is assumed to follow a uniform distribution for values 20 ≤ x ≤ 30. Values of X…
A:
Q: (a) Do you think respondents could select more than one response? Explain. (b) Could the same…
A: 1(a) Yes, respondents could select more than 1 response as the total value of the percentages is…
Q: The following data represent the Sales (in $1000) data gathered from a marketing efficacy study in…
A: The provided data is inserted in Excel as follows:
Q: 1. The joint density of X and Y is (a) Find c. (b) Find E[X] and E[Y]. (c) Find P(X + Y ≤ 1). fxy(x,…
A: As per our guidelines, we are supposed to answer only 3 sub-parts. a) To find the value of c, we…
Q: Identify the null hypothesis, alternative hypothesis, test statistic, p-value(s), conclusion about…
A: The question is about hypo. testingGiven :No. of babies born using given method ( n ) = 325No. of…
Q: Find the expected frequencies if it is assumed that the number of absentees is independent of the…
A: The data is given on the number of pupils absent on particular days.DayOM125Tu88W85Th94F108Total500
Q: A company that makes robotic vacuums claims that their newest model of vacuum lasts, on average, two…
A: A company that makes robotic vacuums claims that their newest model of vacuum lasts, on average, two…
Q: A poll of 2,188 randomly selected adults showed that 90% of them own cell phones. The technology…
A:
Q: The household income (in $1000) last year had a normal distribution with a mean of $57. We want to…
A: From the provided information,Sample size (n) = 16The claim is that the average household income…
Q: students are unprepared for a surprise true/false test v vers are guesses. standard deviation for…
A:
Q: Hamilton County Judges Reporter Kristen DelGuzzi of The Cincinnati Enquirer is writing a piece about…
A: The question is about probability Given : Total no. od cases = 182908 No. of reversed cases of…
Q: Consider the following exponential probability density function. a. Which of the following is the…
A: The exponential probability density function is given by; f(x)=12e-x2 for x≥0
Q: how about part D, how to solve that?
A: The information provided in the question are as follows :-…
Q: Hamilton County Judges Reporter Kristen DelGuzzi of The Cincinnati Enquirer is writing a piece about…
A: From the provided tree diagram, the following are interpreted: The no of cases that are appealed:…
Q: The table below shows the number of state-registered automatic weapons and the murder rate for…
A: We have given data in the form of table which contains, the number of state-registered automatic…
Q: Assuming that the population is normally distributed, construct a 95% confidence interval estimate…
A: The question is about confidence intervalGiven :To find :1 ) 95 % CI estimate for the popl. mean…
Q: A container of soda is supposed to contain 1000 milliliters of soda. A quality control manager wants…
A: we conduct a hypothesis test using the Chi-Square distribution. Null Hypothesis (H0): The standard…
Q: The scores on an international business entrance have a mean of 480 and a standard deviation of 90.…
A: The mean of data is given as-The standard deviation of the data is given as-
Q: 12. Find the z-score boundaries that separate a normal distribution as described in each of the…
A: We need to find the z-score boundaries that separate a normal distribution as described in…
Q: A newspaper published an article about a study in which researchers subjected laboratory gloves to…
A: We have given thatn1 = 282 n2 = 282 Significance level (α) = 0.10Now,p̂1 = 62%p̂2 = 14% We have…
Q: Suppose that the age of students at George Washington Elementary school is uniformly distributed…
A: Let denote the age of a randomly chosen student from George Washington Elementary School.It is…
Q: The systolic blood pressure of adults in the USA is nearly normally distributed with a mean of 118…
A: Mean()=118standard deviation()=19Someone qualifies as having Stage 2 high blood pressure if their…
Q: 68 randomly selected car salespersons were asked the number of cars they generally sell in one week.…
A: No. of people answered that they generally sell 3 cars = 11No. of people answered that they…
Q: 1, 59, 60, 60, 60, 60, 61, 62, 62, 62, 62, 63, 64, 64, 64, 64, 64, 65, 65, 65, 66, 67, 67, 67, 67,…
A: The given data is 1, 59, 60, 60, 60, 60, 61, 62, 62, 62, 62, 63, 64, 64, 64, 64, 64, 65, 65, 65, 66,…
Q: 3. Find the Bayes rule for loss L(a,0) = 2 = (ª - 1) ²,
A: We have to find the Bayes rule for loss .
Q: A decade-old study found that the proportion, p, of high school seniors who believed that "getting…
A: as per policy i have calculated 3 subparts n = 215 X = 179 sample proportion = X /n = 179/ 215…
Q: In a textile factory, 1,400 garments are designed and produced during the last month, of which…
A: "In a textile factory, 1,400 garments are designed and produced during the last month, of which…
Q: In the largest clinical trial ever conducted, 401,974 children were randomly assigned to two groups.…
A: n1=201229 Sample size of treatment group n2=200745 Sample size of placebo group x1= 33 success…
Q: 1. Explain what is meant by i. Primary data collection ii. Secondary data collection iii. State two…
A: Note: As per our guidelines we are supposed to answer only 3 subparts of any questions so i am…
Q: Use the sample data and confidence level to construct the confidence interval estimate of the…
A: n = 500 x = 200 Confidence level = 95% sample proportion = x/n = 200 /500 = 0.4
Q: Let x be a continuous random variable and let c be a constant. Which of the following statements is…
A: The questions explore key concepts related to probability distributions and random variables. The…
Q: The median incomes of males in a random sample of 30 states of the United States, including the…
A: The shape of the raw data can be visualized using the histogram. It is used for continuous data…
Q: Exercise 06.27 Algo (Exponential Probability Distribution) Consider the following exponential…
A: The question is about exponential dist. Given : x be a continuous r.v which follows exponential…
Q: A random sample of 25 Berkeley College students was asked, "How many hours per week typically do you…
A: a. To find the mean, median, and mode of the hours worked outside the home for the sample data,…
Q: what is the maximum number of devices that we would need to randomly select to ensure that the…
A: If the probability density function for the number of faulty devices manufactured is normally…
Q: Which of the following is not a cause of perfect multicollinearity? Select all that apply.
A: Correct Option : c,e
Q: The normal quantile plot shown to the right represents duration times (in seconds) of eruptions of…
A: The given normal quantile plot represents the duration times of eruptions of a certain geyser from…
Trending now
This is a popular solution!
Step by step
Solved in 3 steps with 2 images
- A data set with whole numbers has a low value of 20 and a high value of 89.Find the class width for a frequency table with seven classes.During one shift, the express lane clerk recorded how many times customers violated the "10 items or less" rule for his lane. In particular, he recorded how many items over the limit each violator placed on the conveyor belt. This data is summarized in the histogram below. NOTE: The last class actually represents "7 or more items," not just 7 items. What is the frequency of times the limit was exceeded by at most 5 items?Answer: timesA data set with whole numbers has a low value of 10 and a high value of 120. Find the class width and class limits for a frequency table with 5 classes.
- In a data set, the smallest data value is 7 and the largest data value is 54. If you want to make a frequency table with 5 classes, what is the class width? Group of answer choices 5 9 9.4 10 47During one shift, the express lane clerk recorded how many times customers violated the "10 items or less" rule for his lane. In particular, he recorded how many items over the limit each violator placed on the conveyor belt. This data is summarized in the histogram below. NOTE: The last class actually represents "7 or more items," not just 7 items. What is the frequency of times the limit was exceeded by at least 4 items?ans =Dr. Stewart is a veterinarian who says only dogs and cats. In each appointment, she may or may not get the animal vaccine. The two way frequency table summarizes Dr. Stewart’s 80 appointment last week
- Students in a class were asked how many movies they had seen in the last month. The results are below. {1,4,3,2,2,3,1,0,0,1,3,2,4,5,1,2,8,0,2,1,3,4,5} Make a frequency table to organize the data. After you have done this answer the following questions. a) What percentage had seen more than 4 movies? b) What percentage has seen at least 2 movies? Must show all work2.The histogram to the right represents the weights (in pounds) of members of a certain high-school programming team. What is the class width? What are the approximate lower and upper class limits of the first class? What is the class width? The class width is. (Simplify your answer.) + Frequency 105 115 125 135 145 155 165 175 Weight (lbs).he Environmental Protection Agency (EPA) uses a measure called the Pollutant Standards Index (PSI) to measure air quality in a city. A PSI reading over 100 indicates a day when the air quality is considered unhealthy. The measurements represent the number of days in 1995 that the PSI was over 100 for twenty metropolitan areas in the U.S. Midwest.0, 0, 0, 1, 1, 1, 1, 1, 2, 2, 3, 4, 4, 4, 4, 5, 7, 7, 11, 14A careless employee originally recorded a number that was at least 20 times larger than 14:0, 0, 0, 1, 1, 1, 1, 1, 2, 2, 3, 4, 4, 4, 4, 5, 7, 7, 11, (much larger than 14)The employee's mistake would have the following effect:The median would stay the sameincrease decrease The mean would decreaseincrease stay the same The mode would increasestay the same decrease The IQR would increasedecrease stay the same The standard deviation would decreaseincrease stay the same
- The Environmental Protection Agency (EPA) uses a measure called the Pollutant Standards Index (PSI) to measure air quality in a city. A PSI reading over 100 indicates a day when the air quality is considered unhealthy. The measurements represent the number of days in 1995 that the PSI was over 100 for twenty metropolitan areas in the U.S. Midwest. 0, 0, 0, 1, 1, 1, 1, 1, 2, 2, 3, 4, 4, 4, 4, 5, 7, 7, 11, 14 Which of the above is the appropriate boxplot for this data?AB C When we drew the boxplot for this data we found no extreme outliers:truefalsech 15 end. 2: Last rating period, the percentages of viewers watching several channels between 11 p.m. and 11:30 p.m. in a major TV market were as follows:A researcher for the EPA measured the amount of arsenic in the water near a sewage treatment plant. Over 12 days, he took measurements (in ppb). His sample data is summarized in the frequency distribution polygon shown below. How many measurements taken in this time frame were within ppb?