The data shown below represent the repair cost for a low-impact collision in a simple random sample of mini- and micro-vehicles. Complete parts (a) through (d) below. $3175 $1094 $747 $671 $790 $1700 $3378 $2028 $2623 $1302 Click the icon to view the table of critical correlation coefficient values for normal probability plots. C Since the correlation between the expected z-scores and the observed data, the critical value , it reasonable to conclude that the data come from a population that is normally distributed. (Round to three decimal places as needed.)
The data shown below represent the repair cost for a low-impact collision in a simple random sample of mini- and micro-vehicles. Complete parts (a) through (d) below. $3175 $1094 $747 $671 $790 $1700 $3378 $2028 $2623 $1302 Click the icon to view the table of critical correlation coefficient values for normal probability plots. C Since the correlation between the expected z-scores and the observed data, the critical value , it reasonable to conclude that the data come from a population that is normally distributed. (Round to three decimal places as needed.)

Glencoe Algebra 1, Student Edition, 9780079039897, 0079039898, 2018
18th Edition
ISBN:9780079039897
Author:Carter
Publisher:Carter
Chapter4: Equations Of Linear Functions
Section4.5: Correlation And Causation
Problem 23PFA

Related questions
Question
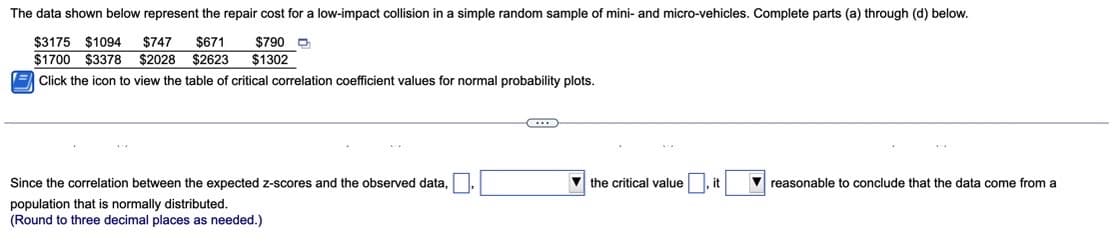
Transcribed Image Text:The data shown below represent the repair cost for a low-impact collision in a simple random sample of mini- and micro-vehicles. Complete parts (a) through (d) below.
$3175 $1094 $747 $671
$790
$1700 $3378 $2028 $2623 $1302
Click the icon to view the table of critical correlation coefficient values for normal probability plots.
Since the correlation between the expected z-scores and the observed data,.
the critical value it
reasonable to conclude that the data come from al
population that is normally distributed.
(Round to three decimal places as needed.)
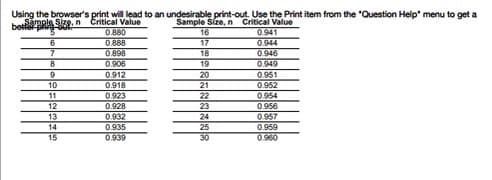
Transcribed Image Text:Using the browser's print will lead to an undesirable print-out. Use the Print item from the "Question Help" menu to get a
betapa size.
Critical Value
Sample Size, n Critical Value
0.880
16
0.941
6
0.888
17
0.944
7
0.898
18
0.946
8
0.906
19
0.949
9
0.912
20
0.951
10
0.918
0.952
11
0.923
0.954
12
0.928
0.956
13
0.932
0.957
14
0.935
0.959
15
0.939
0.960
21
22
23
24
25
30
Expert Solution
This question has been solved!
Explore an expertly crafted, step-by-step solution for a thorough understanding of key concepts.

This is a popular solution!

Trending now
This is a popular solution!

Step by step
Solved in 3 steps with 5 images

Recommended textbooks for you
Glencoe Algebra 1, Student Edition, 9780079039897…
Algebra
ISBN:
9780079039897
Author:
Carter
Publisher:
McGraw Hill
Glencoe Algebra 1, Student Edition, 9780079039897…
Algebra
ISBN:
9780079039897
Author:
Carter
Publisher:
McGraw Hill