The data shown here represent the number of miles per gallon that 30 selected four-wheel-drive sports utility vehicles obtained in city driving. Construct a grouped frequency distribution into 5 classes. i. Using an ogive, visualize these data values. i. 12 17 12 14 16 18 16 18 12 16 17 15 15 16 12 15 16 16 12 14 15 12 15 15 19 13 16 18 16 14
The data shown here represent the number of miles per gallon that 30 selected four-wheel-drive sports utility vehicles obtained in city driving. Construct a grouped frequency distribution into 5 classes. i. Using an ogive, visualize these data values. i. 12 17 12 14 16 18 16 18 12 16 17 15 15 16 12 15 16 16 12 14 15 12 15 15 19 13 16 18 16 14

Glencoe Algebra 1, Student Edition, 9780079039897, 0079039898, 2018
18th Edition
ISBN:9780079039897
Author:Carter
Publisher:Carter
Chapter10: Statistics
Section10.6: Summarizing Categorical Data
Problem 4BGP

Related questions
Question
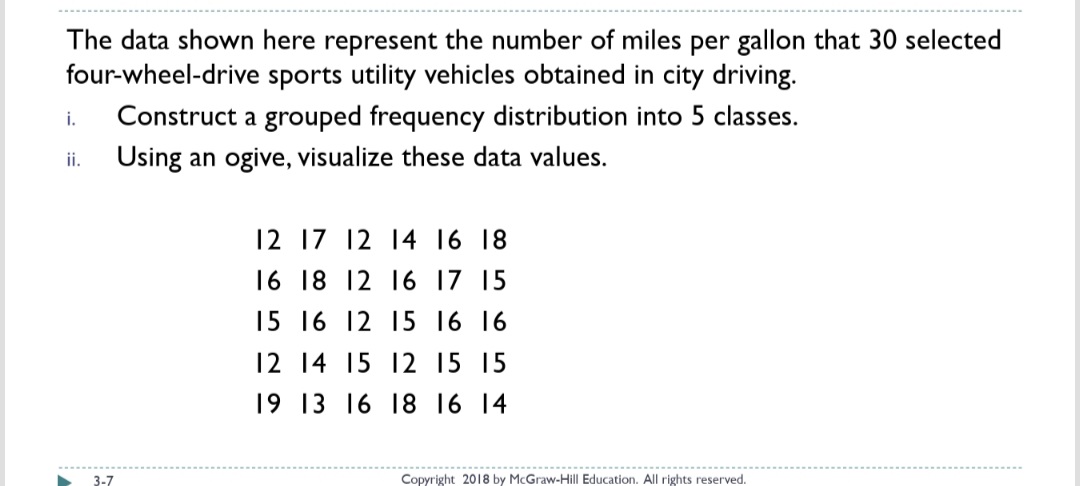
Transcribed Image Text:The data shown here represent the number of miles per gallon that 30 selected
four-wheel-drive sports utility vehicles obtained in city driving.
Construct a grouped frequency distribution into 5 classes.
i.
Using an ogive, visualize these data values.
i.
12 17 12 14 16 18
16 18 12 16 17 15
15 16 12 15 16 16
12 14 15 12 15 15
19 13 16 18 16 14
3-7
Copyright 2018 by McGraw-Hill Education. All rights reserved.
Expert Solution
This question has been solved!
Explore an expertly crafted, step-by-step solution for a thorough understanding of key concepts.

This is a popular solution!

Trending now
This is a popular solution!

Step by step
Solved in 3 steps with 1 images

Knowledge Booster


Learn more about
Need a deep-dive on the concept behind this application? Look no further. Learn more about this topic, statistics and related others by exploring similar questions and additional content below.Recommended textbooks for you
Glencoe Algebra 1, Student Edition, 9780079039897…
Algebra
ISBN:
9780079039897
Author:
Carter
Publisher:
McGraw Hill
Glencoe Algebra 1, Student Edition, 9780079039897…
Algebra
ISBN:
9780079039897
Author:
Carter
Publisher:
McGraw Hill