Use this frequency distribution and the information in the paragraph above to answer the questions that follow. a. How many people were living in Utica at the time thi information was gathered? b. What percent of Utica residents are American Indian, Hispanic, or Native Hawaiian & Other Pacific Islander? c. What percent of Utica residents are not white?
Use this frequency distribution and the information in the paragraph above to answer the questions that follow. a. How many people were living in Utica at the time thi information was gathered? b. What percent of Utica residents are American Indian, Hispanic, or Native Hawaiian & Other Pacific Islander? c. What percent of Utica residents are not white?

Glencoe Algebra 1, Student Edition, 9780079039897, 0079039898, 2018
18th Edition
ISBN:9780079039897
Author:Carter
Publisher:Carter
Chapter10: Statistics
Section10.6: Summarizing Categorical Data
Problem 4BGP

Related questions
Question
Transcribed Image Text:QUESTION 1
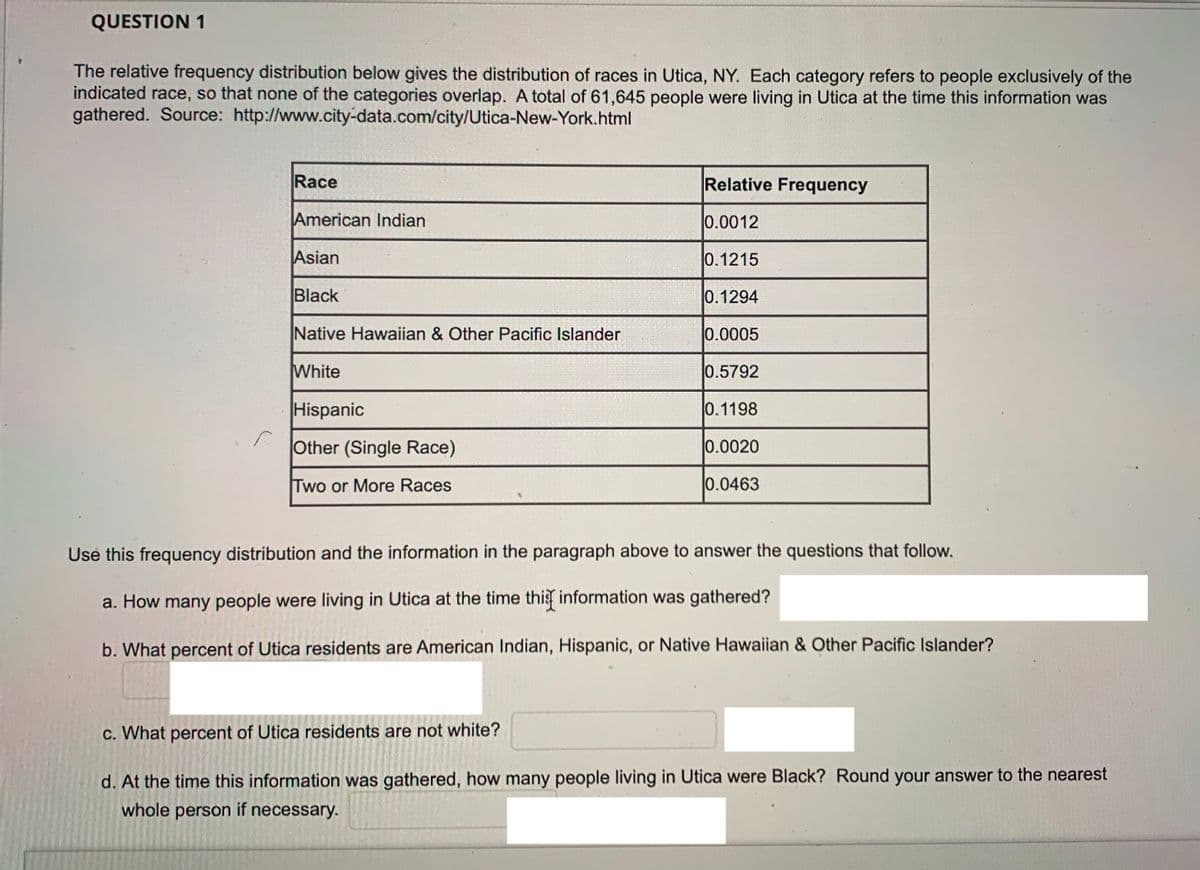
The relative frequency distribution below gives the distribution of races in Utica, NY. Each category refers to people exclusively of the
indicated race, so that none of the categories overlap. A total of 61,645 people were living in Utica at the time this information was
gathered. Source: http://www.city-data.com/city/Utica-New-York.html
Race
Relative Frequency
American Indian
0.0012
Asian
0.1215
Black
0.1294
Native Hawaiian & Other Pacific Islander
0.0005
White
0.5792
Hispanic
0.1198
Other (Single Race)
0.0020
Two or More Races
0.0463
Use this frequency distribution and the information in the paragraph above to answer the questions that follow.
a. How many people were living in Utica at the time thi information was gathered?
b. What percent of Utica residents are American Indian, Hispanic, or Native Hawaiian & Other Pacific Islander?
c. What percent of Utica residents are not white?
d. At the time this information was gathered, how many people living in Utica were Black? Round your answer to the nearest
whole person if necessary.
Expert Solution
This question has been solved!
Explore an expertly crafted, step-by-step solution for a thorough understanding of key concepts.

Step by step
Solved in 4 steps

Recommended textbooks for you
Glencoe Algebra 1, Student Edition, 9780079039897…
Algebra
ISBN:
9780079039897
Author:
Carter
Publisher:
McGraw Hill
Glencoe Algebra 1, Student Edition, 9780079039897…
Algebra
ISBN:
9780079039897
Author:
Carter
Publisher:
McGraw Hill