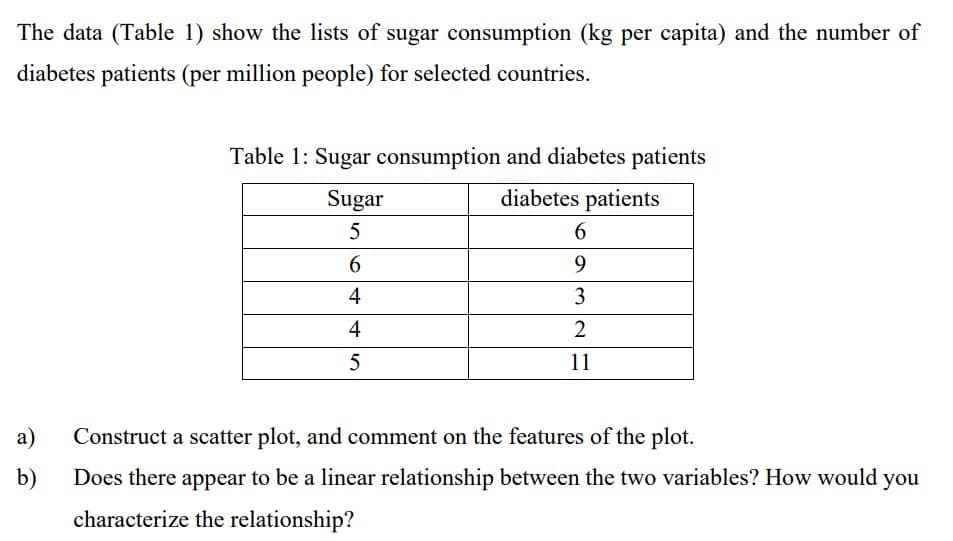
The data (Table 1) show the lists of sugar consumption (kg per capita) and the number of diabetes patients (per million people) for selected countries. Table 1: Sugar consumption and diabetes patients Sugar diabetes patients 5 6 4 4 5 6 9 3 2 11 a) Construct a scatter plot, and comment on the features of the plot. b) Does there appear to be a linear relationship between the two variables? How would you characterize the relationship?
The data (Table 1) show the lists of sugar consumption (kg per capita) and the number of diabetes patients (per million people) for selected countries. Table 1: Sugar consumption and diabetes patients Sugar diabetes patients 5 6 4 4 5 6 9 3 2 11 a) Construct a scatter plot, and comment on the features of the plot. b) Does there appear to be a linear relationship between the two variables? How would you characterize the relationship?

Glencoe Algebra 1, Student Edition, 9780079039897, 0079039898, 2018
18th Edition
ISBN:9780079039897
Author:Carter
Publisher:Carter
Chapter10: Statistics
Section10.2: Representing Data
Problem 10PPS

Related questions
Question
psda
Transcribed Image Text:The data (Table 1) show the lists of sugar consumption (kg per capita) and the number of
diabetes patients (per million people) for selected countries.
Table 1: Sugar consumption and diabetes patients
Sugar
diabetes patients
5
6
4
4
5
6
9
3
2
11
a) Construct a scatter plot, and comment on the features of the plot.
b)
Does there appear to be a linear relationship between the two variables? How would you
characterize the relationship?
Expert Solution
This question has been solved!
Explore an expertly crafted, step-by-step solution for a thorough understanding of key concepts.

Step by step
Solved in 2 steps with 2 images

Recommended textbooks for you
Glencoe Algebra 1, Student Edition, 9780079039897…
Algebra
ISBN:
9780079039897
Author:
Carter
Publisher:
McGraw Hill


Trigonometry (MindTap Course List)
Trigonometry
ISBN:
9781337278461
Author:
Ron Larson
Publisher:
Cengage Learning
Glencoe Algebra 1, Student Edition, 9780079039897…
Algebra
ISBN:
9780079039897
Author:
Carter
Publisher:
McGraw Hill
Trigonometry (MindTap Course List)
Trigonometry
ISBN:
9781337278461
Author:
Ron Larson
Publisher:
Cengage Learning

Algebra & Trigonometry with Analytic Geometry
Algebra
ISBN:
9781133382119
Author:
Swokowski
Publisher:
Cengage


Big Ideas Math A Bridge To Success Algebra 1: Stu…
Algebra
ISBN:
9781680331141
Author:
HOUGHTON MIFFLIN HARCOURT
Publisher:
Houghton Mifflin Harcourt