The data table contains waiting times of customers at a bank, where customers enter a single waiting line that feeds three teller windows. Test the claim that the standard deviation of waiting times is less than 1.8 minutes, which is the standard deviation of waiting times at the same bank when separate waiting lines are used at each teller window. Use a significance level of 0.025. Assume that the sample is a simple random sample selected from a normally distributed population. a. Compute the test statistic. chi squared equals (Round to two decimal places as needed.) b. Find the P-value of the test statistic. The P-value of the test statistic is (Round to three decimal places as needed.)
The data table contains waiting times of customers at a bank, where customers enter a single waiting line that feeds three teller windows. Test the claim that the standard deviation of waiting times is less than 1.8 minutes, which is the standard deviation of waiting times at the same bank when separate waiting lines are used at each teller window. Use a significance level of 0.025. Assume that the sample is a simple random sample selected from a normally distributed population. a. Compute the test statistic. chi squared equals (Round to two decimal places as needed.) b. Find the P-value of the test statistic. The P-value of the test statistic is (Round to three decimal places as needed.)

MATLAB: An Introduction with Applications
6th Edition
ISBN:9781119256830
Author:Amos Gilat
Publisher:Amos Gilat
Chapter1: Starting With Matlab
Section: Chapter Questions
Problem 1P

Related questions
Question
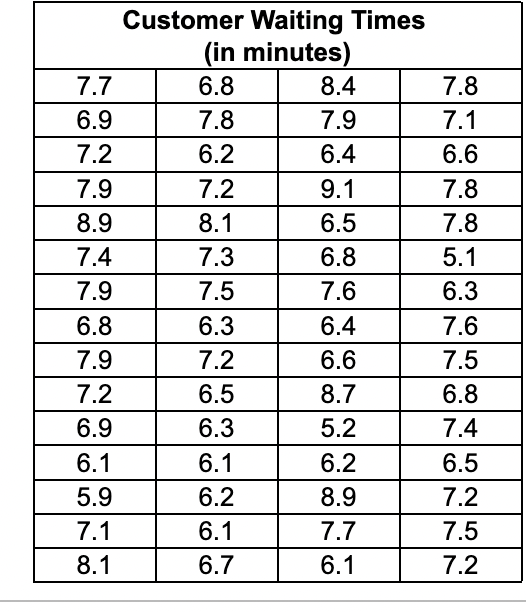
The data table contains waiting times of customers at a bank, where customers enter a single waiting line that feeds three teller windows. Test the claim that the standard deviation of waiting times is less than 1.8 minutes, which is the standard deviation of waiting times at the same bank when separate waiting lines are used at each teller window. Use a significance level of 0.025. Assume that the sample is a simple random sample selected from a
a. Compute the test statistic.
chi squared equals
(Round to two decimal places as needed.)
b. Find the P-value of the test statistic.
The P-value of the test statistic is
(Round to three decimal places as needed.)
Transcribed Image Text:7.7
6.9
7.2
7.9
8.9
7.4
7.9
6.8
7.9
7.2
6.9
6.1
5.9
7.1
8.1
Customer Waiting Times
(in minutes)
6.8
7.8
6.2
7.2
8.1
7.3
7.5
6.3
7.2
6.5
6.3
6.1
6.2
6.1
6.7
8.4
7.9
6.4
9.1
6.5
6.8
7.6
6.4
6.6
8.7
5.2
6.2
8.9
7.7
6.1
7.8
7.1
6.6
7.8
7.8
5.1
6.3
7.6
7.5
6.8
7.4
6.5
7.2
7.5
7.2
Expert Solution
This question has been solved!
Explore an expertly crafted, step-by-step solution for a thorough understanding of key concepts.

This is a popular solution!

Trending now
This is a popular solution!

Step by step
Solved in 3 steps with 1 images

Recommended textbooks for you
MATLAB: An Introduction with Applications
Statistics
ISBN:
9781119256830
Author:
Amos Gilat
Publisher:
John Wiley & Sons Inc

Probability and Statistics for Engineering and th…
Statistics
ISBN:
9781305251809
Author:
Jay L. Devore
Publisher:
Cengage Learning

Statistics for The Behavioral Sciences (MindTap C…
Statistics
ISBN:
9781305504912
Author:
Frederick J Gravetter, Larry B. Wallnau
Publisher:
Cengage Learning
MATLAB: An Introduction with Applications
Statistics
ISBN:
9781119256830
Author:
Amos Gilat
Publisher:
John Wiley & Sons Inc
Probability and Statistics for Engineering and th…
Statistics
ISBN:
9781305251809
Author:
Jay L. Devore
Publisher:
Cengage Learning
Statistics for The Behavioral Sciences (MindTap C…
Statistics
ISBN:
9781305504912
Author:
Frederick J Gravetter, Larry B. Wallnau
Publisher:
Cengage Learning

Elementary Statistics: Picturing the World (7th E…
Statistics
ISBN:
9780134683416
Author:
Ron Larson, Betsy Farber
Publisher:
PEARSON

The Basic Practice of Statistics
Statistics
ISBN:
9781319042578
Author:
David S. Moore, William I. Notz, Michael A. Fligner
Publisher:
W. H. Freeman

Introduction to the Practice of Statistics
Statistics
ISBN:
9781319013387
Author:
David S. Moore, George P. McCabe, Bruce A. Craig
Publisher:
W. H. Freeman