The degrees of freedom is critical to computing the p-value for the chi-square goodness of fit. We will discuss the p-value in the next lab. The degrees of freedom for the Chi-Square goodness of fit is equal to (the number of non-zero rows in the table) - 1. The number of non-zero rows is the number of expected values that are non-zero. For example: Phenotype ... Expected ... Disease ... 234 ... Wild-type ... 6743 ...
The degrees of freedom is critical to computing the p-value for the chi-square goodness of fit. We will discuss the p-value in the next lab. The degrees of freedom for the Chi-Square goodness of fit is equal to (the number of non-zero rows in the table) - 1. The number of non-zero rows is the number of expected values that are non-zero. For example: Phenotype ... Expected ... Disease ... 234 ... Wild-type ... 6743 ...
The degrees of freedom is critical to computing the p-value for the chi-square goodness of fit. We will discuss the p-value in the next lab. The degrees of freedom for the Chi-Square goodness of fit is equal to (the number of non-zero rows in the table) - 1. The number of non-zero rows is the number of expected values that are non-zero. For example: Phenotype ... Expected ... Disease ... 234 ... Wild-type ... 6743 ...
The degrees of freedom is critical to computing the p-value for the chi-square goodness of fit. We will discuss the p-value in the next lab. The degrees of freedom for the Chi-Square goodness of fit is equal to (the number of non-zero rows in the table) - 1. The number of non-zero rows is the number of expected values that are non-zero. For example:
Phenotype
...
Expected
...
Disease
...
234
...
Wild-type
...
6743
...
has two rows where the Expected value is non-zero. So the degrees of freedom is 2-1 = 1.
Another example:
Phenotype
...
Expected
...
Disease
...
2374
...
Wild-type
...
0
...
has one row where the Expected value is non-zero. So the degrees of freedom is 1-1 = 0. With 0 degrees of freedom, the chi-square test cannot be calculated.
A third example (sex-linked):
Phenotype
...
Expected
...
Disease-Male
...
2374
...
Disease-Female
...
9456
Wild-type-Male
...
1001
...
Wild-type-Female
...
235
...
has four rows where the Expected values are non-zero. So the degrees of freedom is 4-1 = 3
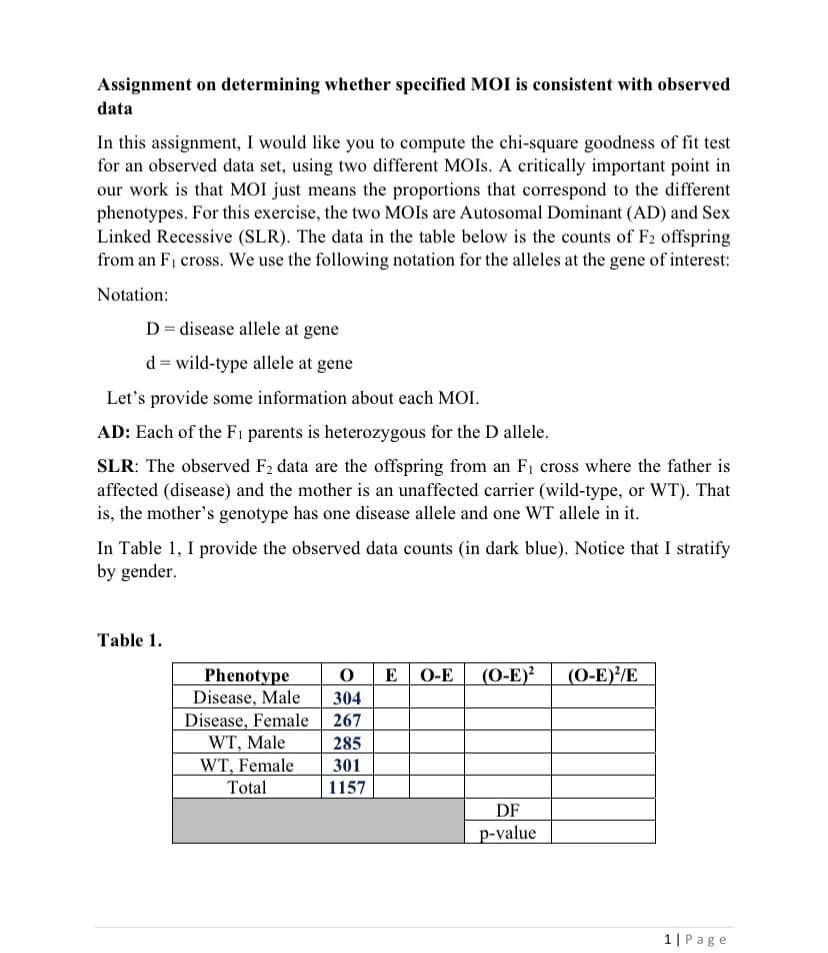
Transcribed Image Text:Assignment on determining whether specified MOI is consistent with observed
data
In this assignment, I would like you to compute the chi-square goodness of fit test
for an observed data set, using two different MOIS. A critically important point in
our work is that MOI just means the proportions that correspond to the different
phenotypes. For this exercise, the two MOIS are Autosomal Dominant (AD) and Sex
Linked Recessive (SLR). The data in the table below is the counts of F2 offspring
from an F1 cross. We use the following notation for the alleles at the gene of interest:
Notation:
D = disease allele at gene
d = wild-type allele at gene
Let's provide some information about each MOI.
AD: Each of the Fi parents is heterozygous for the D allele.
SLR: The observed F2 data are the offspring from an Fi cross where the father is
affected (disease) and the mother is an unaffected carrier (wild-type, or WT). That
is, the mother's genotype has one disease allele and one WT allele in it.
In Table 1, I provide the observed data counts (in dark blue). Notice that I stratify
by gender.
Table 1.
(0-E)²
(O-E)/E
Phenotype
Disease, Male
Disease, Female
WT, Male
E
O-E
304
267
285
WT, Female
301
Total
1157
DF
p-value
1| Page
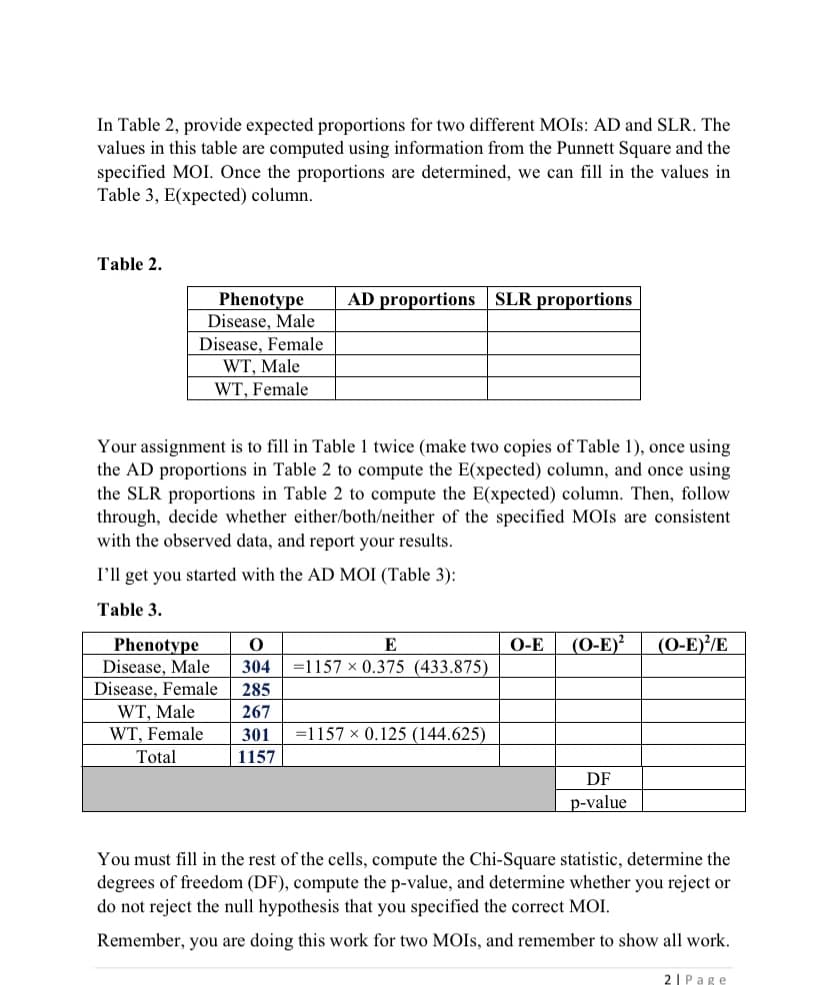
Transcribed Image Text:In Table 2, provide expected proportions for two different MOIS: AD and SLR. The
values in this table are computed using information from the Punnett Square and the
specified MOI. Once the proportions are determined, we can fill in the values in
Table 3, E(xpected) column.
Table 2.
AD proportions SLR proportions
Phenotype
Disease, Male
Disease, Female
WT, Male
WT, Female
Your assignment is to fill in Table 1 twice (make two copies of Table 1), once using
the AD proportions in Table 2 to compute the E(xpected) column, and once using
the SLR proportions in Table 2 to compute the E(xpected) column. Then, follow
through, decide whether either/both/neither of the specified MOIS are consistent
with the observed data, and report your results.
I'll get you started with the AD MOI (Table 3):
Table 3.
(O-E)?
(0-E)'/E
Phenotype
Disease, Male
Disease, Female
WT, Male
E
О-Е
304
=1157 x 0.375 (433.875)
285
267
WT, Female
301
=1157 x 0.125 (144.625)
Total
1157
DF
p-value
You must fill in the rest of the cells, compute the Chi-Square statistic, determine the
degrees of freedom (DF), compute the p-value, and determine whether you reject or
do not reject the null hypothesis that you specified the correct MOI.
Remember, you are doing this work for two MOIS, and remember to show all work.
2I Page
Expert Solution
This question has been solved!
Explore an expertly crafted, step-by-step solution for a thorough understanding of key concepts.