Two samples are drawn from two normal population. From the following data test whether the two samples have the same variance at 5% level : 76 82 85 87 Sample 1 : Sample 2: 61 60 65 71 74 66 67 85 78 63 85 86 88 91
Two samples are drawn from two normal population. From the following data test whether the two samples have the same variance at 5% level : 76 82 85 87 Sample 1 : Sample 2: 61 60 65 71 74 66 67 85 78 63 85 86 88 91

Glencoe Algebra 1, Student Edition, 9780079039897, 0079039898, 2018
18th Edition
ISBN:9780079039897
Author:Carter
Publisher:Carter
Chapter10: Statistics
Section10.5: Comparing Sets Of Data
Problem 14PPS

Related questions
Question
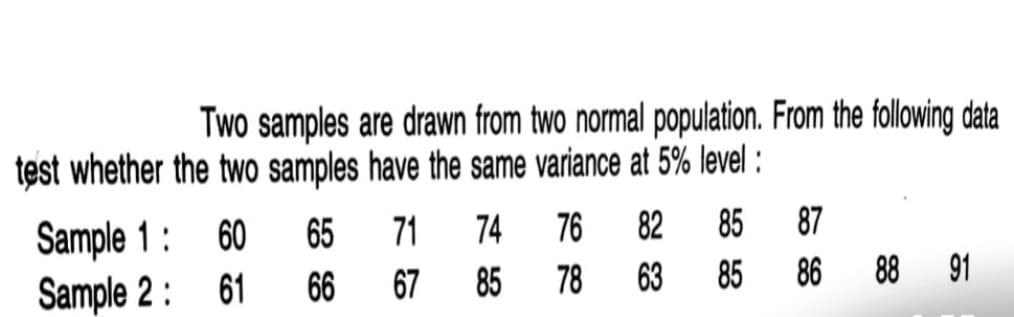
Transcribed Image Text:Two samples are drawn from two normal population. From the following data
test whether the two samples have the same variance at 5% level :
65
74
76
82
85
87
Sample 1 :
Sample 2: 61
60
71
66
67
85
78
63
85
86
88 91
Expert Solution
This question has been solved!
Explore an expertly crafted, step-by-step solution for a thorough understanding of key concepts.

This is a popular solution!

Trending now
This is a popular solution!

Step by step
Solved in 2 steps with 3 images

Recommended textbooks for you
Glencoe Algebra 1, Student Edition, 9780079039897…
Algebra
ISBN:
9780079039897
Author:
Carter
Publisher:
McGraw Hill
Glencoe Algebra 1, Student Edition, 9780079039897…
Algebra
ISBN:
9780079039897
Author:
Carter
Publisher:
McGraw Hill