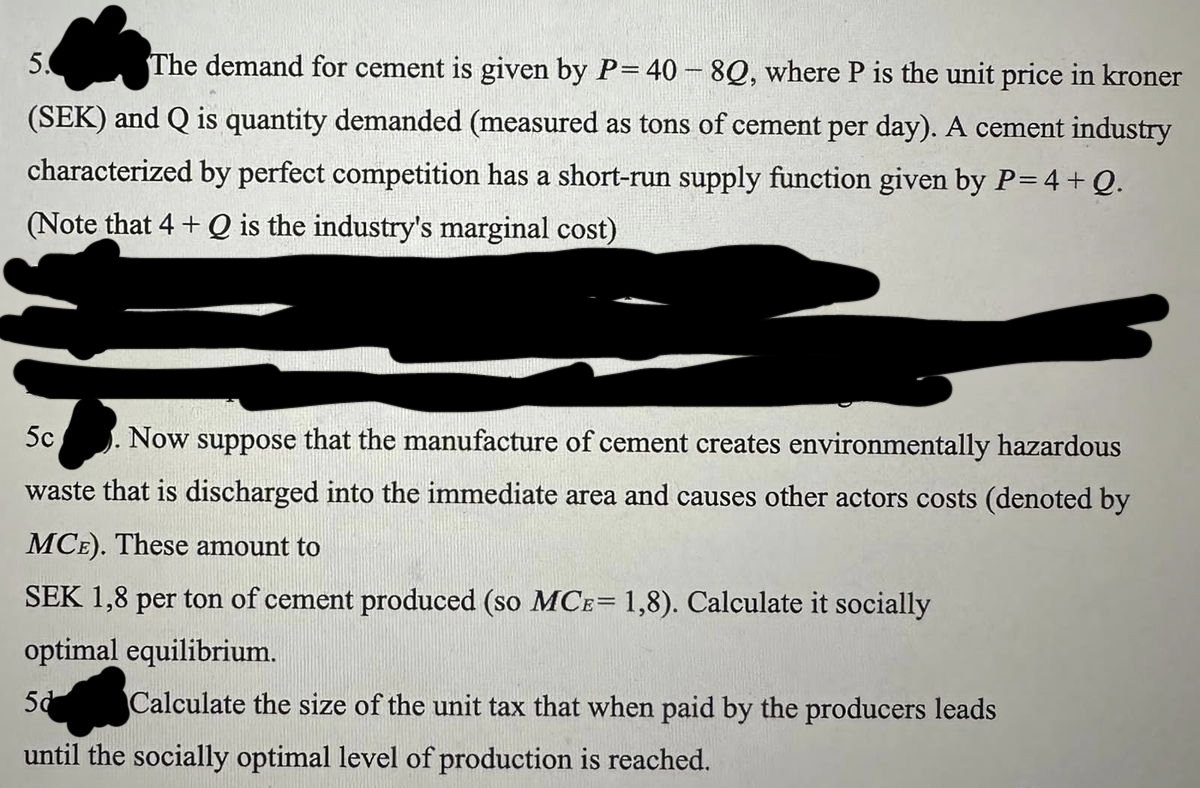
The demand for cement is given by P= 40 - 8Q, where P is the unit price in kroner (SEK) and Q is quantity demanded (measured as tons of cement per day). A cement industry characterized by perfect competition has a short-run supply function given by P=4+Q. (Note that 4+ Q is the industry's marginal cost) 5. 5c Now suppose that the manufacture of cement creates environmentally hazardous waste that is discharged into the immediate area and causes other actors costs (denoted by MCE). These amount to SEK 1,8 per ton of cement produced (so MCE= 1,8). Calculate it socially optimal equilibrium.
Q: Implementation of a taxation is necessary in economy. Explain
A: Taxation is the term used to describe the imposition of obligatory taxes or fees by a government on…
Q: Since Russia invaded Ukraine last year many sanctions have been imposed on Russia. Suppose the…
A: Russia's (country R) heinous war in Ukraine (country U) has already lasted over nine months. Country…
Q: ipam owns a firm that sells basketball apparel. As the firm's output increases, the firm's short-run…
A: An economy refers to the system of interrelated manufacturing and consumption activities that…
Q: Using Excel: Please prove Ernst Engel's law by using Lao data ( the share of agricultural productsin…
A: The GDP is the production of goods and services that is not used in the production process but are…
Q: 4. Consider a variant on the Aghion and Tirole (1997) model. Poppy, the principal, and Aiden, the…
A: Poppy put an effort into E, and bears the cost of 12E2, but gives her the probability of being…
Q: > > > Watch the Video then answer the following questions: ECHOS How We Fight Against Monopolies…
A: Anti-trust law refers to a set of laws and regulations that aim to promote fair competition and…
Q: You have collected a sub-sample from the Current Population Survey for the western region of the…
A: A regression refers to the statistical technique that tells a dependent variable to one or more…
Q: Which of these people will purchase one of the three mountain resort plots? Check all that apply.…
A: In a market, a seller and a buyer interact and make a transaction is they both are able to gain…
Q: Suppose a lawn care company adopts a new scheduling software to replace its old system of filling…
A: Factors affecting demand and supply refer to the various economic, social, and environmental factors…
Q: APPLYING ELASTICITY TO THE REAL WORLD Instructions: Each of the following stories contains an…
A: Price Elasticity of Demand measures the percentage change in quantity demanded of a good or service…
Q: What solution are economists more likely to advocate for instead of rent control?
A: Rent control is a price ceiling policy which government uses to limit the rent charged on housing to…
Q: What changes and what happened at the transportation revolution? and how it changes business and the…
A: The late 18th and early 19th centuries saw the beginning of the transportation revolution, which…
Q: True or False Explain why, Use basic AD/ AS model Suppose that there is a decline in velocity…
A: The AD/AS model is a macroeconomic model that explains the relationship between aggregate demand…
Q: 1. Assume you are the Project Manager of a construction company going to prepare the tender for a…
A: The term "market condition" describes the status of the market at a specific time, including the…
Q: Multiple Choice b O MC Q ATC er to the diagram for a purely competitive producer. If product price…
A: In perfectly competitive market, firms are price takers. Firms sell identical goods so they do not…
Q: Use the Monetary Intertemporal Model that we saw in class to predict the effects of a persistent…
A: The Monetary Intertemporal Model is a model that considers the intertemporal choices of households…
Q: Receive 120 USD in two years
A: To compare the present value of these four options, we need to calculate their present values using…
Q: Figure: External Benefits Price B D E GH M O private cost social value The distance between point E…
A: Externalities are a fundamental concept in environmental economics. In economic terminology, an…
Q: Matthew grows wheat on his farm. One of his fields produced 66.8 bushels of wheat this year. If…
A: Given information: Matthew grows wheat on his farm. One of his fields produced 66.8 bushels of…
Q: Question 1 Suppose that the central bank exogenously determines the supply of money: a. Graph 1:…
A: In a financial economy, financial markets exist to aid in the efficient allocation of money and…
Q: Appledale Dairy is considering upgrading an old ice-cream maker. Extensive upgrading costs $11650…
A: The present worth of a cash flow refers to its value at present worth based on its expected value in…
Q: In the Solow model in which y=Akα (where y is GDP per worker and k is capital per worker), compare…
A: “Since you have posted multiple questions with multiple sub parts, we will provide the solution only…
Q: A reactor for your plant has an initial capital cost of $100,000 and useful life of 5 years
A: Introduction Equivalent uniform annual benefit is the annual annuity with the same value as the net…
Q: The Canadian Government just announced that they will help new start-up companies in the industry of…
A: Demand curve depicts the inverse relationship between price and quantity demanded, keeping other…
Q: Distinguished carefully between the members of each of the following pairs of properties: a.…
A: A regression model is a statistical tool concerned with finding out the dependence between a…
Q: Consider an economy with two goods, consumption c and leisure 1, and a representative consumer. The…
A: Given information Considering an economy with two goods: Consumption, c Leisure, l A consumer's…
Q: The following is cost information for the Creamy Crisp Donut Company. Entrepreneur's potential…
A: Almost every business unit use the idea of "cost." The cost formula has the benefit of producing a…
Q: what is the opportunity cost of a pound of apples what is the opportunity cost of a pound of ban
A: Opportunity cost is the cost of producing one good in terms of other. Opportunity cost shows the…
Q: Derive a bid-rent function for a "typical" firm. Draw a graph of the bid-rent function that is…
A: Bid rent is a concept in urban economics that refers to the maximum amount of money a person or…
Q: The change in consumer spending is 160 and the change in disposable income is 200. Calculate the…
A: The information given is:- Change in consumer spending = 160 Change in disposable income = 200 We…
Q: Suppose that Sam and Teresa are the only consumers of dance classes in a particular market. The…
A: Demand schedule is the tabular representation of quantity demanded at various prices. Demand curve…
Q: A monopolist serves a market with five potential buyers, each of whom would buy at most one piece of…
A: MR and MC: TR describes the value of the quantity sold at each price level. The MR shows the change…
Q: b. The following model is a simplified version of the multiple regression model used by BEST…
A: A multiple regression model explains linear relationship between a dependent variable and one and…
Q: 2. Suppose the central bank of a country is worried about the economy overheating so it enacts a…
A: Since you have posted a question with multiple sub-parts, we will solve the first three sub-parts…
Q: Consider a budget constraint model with two goods X and Y. Suppose X is an inferior good, and the…
A: The substitution effect is the change in quantity demanded of a product that results from a change…
Q: Please no written by hand solution Consider a Hotelling Game with 8 homogeneous firms. Customers…
A: A stable situation in which each player in a game selects a strategy that is optimal given the…
Q: Suppose that your friend operates a pizza restaurant in the building he owns. Similar buildings in…
A: Opportunity costs are the valuation of the next best alternative that must be forgone in order to…
Q: CHALLENGING EXERCISES 14.7. PRICE COMPETITION WITH SEARCH COSTS. Twenty-five different stores sell…
A: In microeconomics, search theory is the study of transactional frictions in which buyers or sellers…
Q: Let the economy in our numerical example be: C = 70 + 0.75Y I = 60 Y* = 520 Exercise 1: Add…
A: The Keynesian Cross is a simple macroeconomic model that shows the relationship between aggregate…
Q: Review the graph at right. What is the unregulated monopoly price? $60 (enter your response as a…
A: In case of a monopoly, The profit is maximized where the marginal cost is equal to the marginal…
Q: What is China's budget constraint? Describe the maximisation problem of China, set up the…
A: In this case, we have to discuss the budget constraint. A budget constraint is a financial concept…
Q: What are the characteristics that set a good manager apart from an incompetent one?
A: Managerial economics involves the use of quantitative and qualitative analysis to perform…
Q: If Charles Lackey's utility costs remain constant at $500 per month, labor at $8 per hour, and cost…
A: The term "multifactor productivity" refers to the measurement of output, performance, and…
Q: 14. Determine the periodic payment for the following deferred annuity. The annuity is an ordinary…
A: Formula: Single payment series future worth: F=P1+in Capital recovery factor: A/P,i,n=i1+in1+in-1
Q: 3. Suppose that total product increases as the firm uses more labor in the short-run, but labor…
A: In this question, some application of differential calculus is used. If the first differentiation of…
Q: In your opinion, why is real GDP a better financial indicator than nominal GDP?
A: The entire monetary worth of all the goods and services produced within a nation's borders over the…
Q: The mixed strategy n.e. to the following game is Prove it mathematically:
A: Here the probability with which player 1 plays L is ‘p’ and the probability with which the player 1…
Q: An amusement park decides to apply two-part tariff rule to set price, given the demand equation…
A: Incase of monopoly, The profit is maximized where the marginal cost is equal to marginal revenue.…
Q: Suppose you have the following information from a closed economy: C = 200+ 0.25 YD I = 150+ 0.25Y -…
A: The IS relation equilibrium can be computed by holding aggregate income on the left-hand side of the…
Q: en pieces of lemon can produce (1)/(4) cup of juice. How much lemon juice could you expect to obtain…
A: 10 Lemon produce = 1/4 juice A box of lemon contains 85 lemons
Step by step
Solved in 3 steps
- 1- Suppose that the total cost function of a firm is given as follows;TC = 500 + 2Q2And the price of the firm’s product is determined by the market equilibrium at $100.a- Set the profit maximizing condition . Find the profit maximizing output level for this firm .b- What is the total revenue ?c- What is the total cost ?d- What is the profit earned by the firm ?e- Illustrate your answer by using a well-labeled graph .f- Denote the break even price level with Pb on the same graph .g- Denote the shut down price level with Ps on the same graph.h- Show the firm’s supply curve on the same graph .i- Does the firm function in short-run or long-run ? Why ?7. Short-run supply and long-run equilibrium Consider the competitive market for copper. Assume that, regardless of how many firms are in the industry, every firm in the industry is identical and faces the marginal cost (MC), average total cost (ATC), and average variable cost (AVC) curves shown on the following graph.7. Short-run supply and long-run equilibrium Consider the competitive market for copper. Assume that, regardless of how many firms are in the industry, every firm in the industry is identical and faces the marginal cost (MC), average total cost (ATC), and average variable cost (AVC) curves shown on the following graph. The following diagram shows the market demand for copper. Use the orange points (square symbol) to plot the initial short-run industry supply curve when there are 10 firms in the market. (Hint: You can disregard the portion of the supply curve that corresponds to prices where there is no output since this is the industry supply curve.) Next, use the purple points (diamond symbol) to plot the short-run industry supply curve when there are 15 firms. Finally, use the green points (triangle symbol) to plot the short-run industry supply curve when there are 20 firms. If there were 20 firms in this market, the short-run equilibrium price of copper would be ___ per…
- 8-3 Outline the conditions under which a firm should produce in the short run rather than shut down, even though it incurs an economic loss5.(Minimizing Loss in the Short Run) Explain the different options a firm has for minimizing losses in the short run7. Short-run supply and long-run equilibrium Consider the competitive market for titanium. Assume that, regardless of how many firms are in the industry, every firm in the industry is identical and faces the marginal cost (MC), average total cost (ATC), and average variable cost (AVC) curves shown on the following graph. The following diagram shows the market demand for titanium. Use the orange points (square symbol) to plot the initial short-run industry supply curve when there are 10 firms in the market. (Hint: You can disregard the portion of the supply curve that corresponds to prices where there is no output since this is the industry supply curve.) Next, use the purple points (diamond symbol) to plot the short-run industry supply curve when there are 15 firms. Finally, use the green points (triangle symbol) to plot the short-run industry supply curve when there are 20 firms. If there were 20 firms in this market, the short-run equilibrium price of titanium would…Suppose that the seitan industry is initially operating in long-run equilibrium at a price level of $5 per pound of seitan and quantity of 175 million pounds per year. Suppose a top medical journal publishes research that animal-alternative protein sources such as seitan could increase your expected lifespan by 5 years. The publication is expected to cause consumers to demand (less/more) seitan at every price. In the short run, firms will respond by ( attached image). Shift the demand curve, the supply curve, or both on the following graph to illustrate these short-run effects of the publication In the long run, some firms will respond by (attached image) until (consumer demand returns to original level, each firm in the industry is once again earning zero profit, seitan populations grow large enough to support more firms, new technologies are discovered that lower costs) Now Shift the demand curve, the supply curve, or both on another graph (same as the first) to illustrate both…
- E3 Consider a perfectly competitive firm in a short run scenario. Its total cost function is TC(q)= 4q^2 + 8. The market demand function is Q(p) = 800 - 15p, and there are 40 identical firms in the market. A. What is a firm's short-run supply function? Will it ever decide to shut down? Explain. And what is the market supply function? B. Suppose there are 40 identical firms in the market. What is the equilibrium price, p*? What is the equilibrium quantity supplied by each firm, q*? What is each firm's equilibrium profit? Will there be more entry into the market? Why? C. Repeat b, but with 80 firms this time. Label your results with superscript ** D. Repeat part b, but with 280 identical firms now. Label your results by superscript ***. Part E. Compare your results in parts b - d. Explain why the increase in the number of firms affects the results in that manner. What should happen to profit eventually as the number of firms keeps increasing? And when this happens to profit,…Please no written by hand solutions 9. A firm produces a product in a perfectly competitive industry and has a short-run total cost function of SRTC= 50+ 4q+2q. In the short-run, the market equilibrium price is $20 and the firm's profit maximizing quantity is_ Assuming there is no change in cost structure, in the long-run the equilibrium price changes to a. 4; $24 b. 4:$15 c. 5; $24 d. 5:$15 10. The market for sugar consists of 3,500 identical firms, each with the following short-run total cost function: SRTC-1,500+ 35q. The market demand curve for sugar is Q=11,200- 30P. What is each firm's short-run profit? a. So b. $280 c. -$1,080 d. -$1,360 e. -$1,5001) On a graph for a representative firm in a perfectly competitive industry, depict the three cost curves AVC, ATC, and MC (assume typical U-shaped cost curves). Now assume the market price, P, is such that it intersects the upward-sloping portion of MC above ATC. Graphically depict the short-run equilibrium q (representative firm's output) and π (representative firm's profit) under this price scenario. 2) Given the situation you graphically depicted in #1, please state the level of economic profits (positive, zero, negative) of this representative firm and explain why this is the case.
- (Figure: Price and Quantity of Output and Table I) For simplicity, assume that there are only three firms in a perfectly competitive industry; their short-run supply curves are depicted in the graph. At a market price of $40, the industry output is ____. A. 4 B. 1 C. 15 D. 9.5 Note:- Please avoid using ChatGPT and refrain from providing handwritten solutions; otherwise, I will definitely give a downvote. Also, be mindful of plagiarism. Answer completely and accurate answer. Rest assured, you will receive an upvote if the answer is accurate.Assume the following total cost schedule for a perfectly competitive firm. Output TVC TFC 0 0 100 1 40 100 2 70 100 3 120 100 4 180 100 5 250 100 6 330 100 The total cost of producing 6 units of output is __________________ If the firm is producing at an output level of 2 units, the ATC is _____________ and the AVC is ______________ The profit-maximizing firm would shut down in the short run if the market price of its output dropped below ___________________ At what price would a profit-maximizing firm earn zero economic profits? _______________Consider the graphs of a constant cost industry and a perfectly competitive firm within it. Initially, the industry is in long‑run equilibrium at point E, then demand shifts from Demand1 to Demand2. Answer the questions where P is the price, MR is the marginal revenue, AR is the average revenue, MC is the marginal cost, SRATC is the short‑run average total cost, and LRAC is the long‑run average total cost. Manipulate both of the graphs to reflect the adjustments that yield the long‑run equilibrium.