The Descriptive Statistic Interpretation and Analysis Statistics on Series EFFR Quarterly Data From 1954:01 To 2023:02 Observations 276 Skipped/Missing 2 Sample Mean 12.868526 4.596643 Variance Standard Error 0.215928 t-Statistic (Mean=0) (Mean=0) 0.000000 Skewness 0.000000 Kurtosis (excess) 0.000035 Jarque-Bera 0.000000 3.587273 SE of Sample Mean 21.287804 Signif Level 1.008315 Signif Level (Sk=0) Signif Level (Ku=0) 64.345237 Signif Level (JB=0) Minimum 17.780000 01-%ile 16.032500 05-%ile 10.961667 10-%ile 9.335000 25-%ile 6.280833 Median 1.236303 0.060000 Maximum 0.073333 99-%ile 0.093333 95-%ile 0.156667 90-%ile 1.835000 75-%ile 4.170000
The Descriptive Statistic Interpretation and Analysis Statistics on Series EFFR Quarterly Data From 1954:01 To 2023:02 Observations 276 Skipped/Missing 2 Sample Mean 12.868526 4.596643 Variance Standard Error 0.215928 t-Statistic (Mean=0) (Mean=0) 0.000000 Skewness 0.000000 Kurtosis (excess) 0.000035 Jarque-Bera 0.000000 3.587273 SE of Sample Mean 21.287804 Signif Level 1.008315 Signif Level (Sk=0) Signif Level (Ku=0) 64.345237 Signif Level (JB=0) Minimum 17.780000 01-%ile 16.032500 05-%ile 10.961667 10-%ile 9.335000 25-%ile 6.280833 Median 1.236303 0.060000 Maximum 0.073333 99-%ile 0.093333 95-%ile 0.156667 90-%ile 1.835000 75-%ile 4.170000

Algebra for College Students
10th Edition
ISBN:9781285195780
Author:Jerome E. Kaufmann, Karen L. Schwitters
Publisher:Jerome E. Kaufmann, Karen L. Schwitters
Chapter10: Exponential And Logarithmic Functions
Section10.6: Exponential Equations, Logarithmic Equations, And Problem Solving
Problem 63PS

Related questions
Question
Please provide a long analysis that’s well detail for the skewness and Kurtosis as soon as possible :::: NO SHORT ANSWERs
Transcribed Image Text:5:23
◄ WhatsApp
←
ECO 4000 - Group Assign...
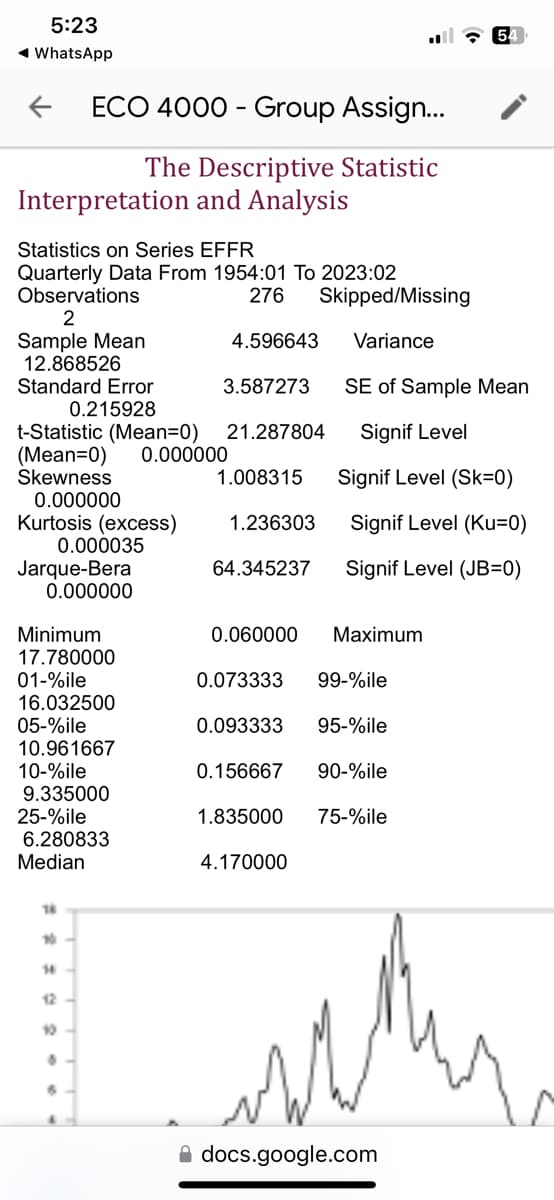
The Descriptive Statistic
Interpretation and Analysis
Statistics on Series EFFR
Quarterly Data From 1954:01 To 2023:02
Observations
2
Sample Mean
12.868526
Standard Error
0.215928
t-Statistic (Mean=0)
(Mean=0) 0.000000
Skewness
0.000000
Kurtosis (excess)
0.000035
Jarque-Bera
0.000000
Minimum
17.780000
01-%ile
16.032500
05-%ile
10.961667
10-%ile
9.335000
25-%ile
6.280833
Median
18
14
12
10
8
6
276 Skipped/Missing
4.596643 Variance
3.587273 SE of Sample Mean
21.287804
Signif Level
1.008315
Signif Level (Sk=0)
1.236303
Signif Level (Ku=0)
64.345237 Signif Level (JB=0)
54
0.060000 Maximum
0.073333 99-%ile
0.093333 95-%ile
0.156667 90-%ile
1.835000 75-%ile
4.170000
docs.google.com
Transcribed Image Text:5:24
◄ WhatsApp
mathera
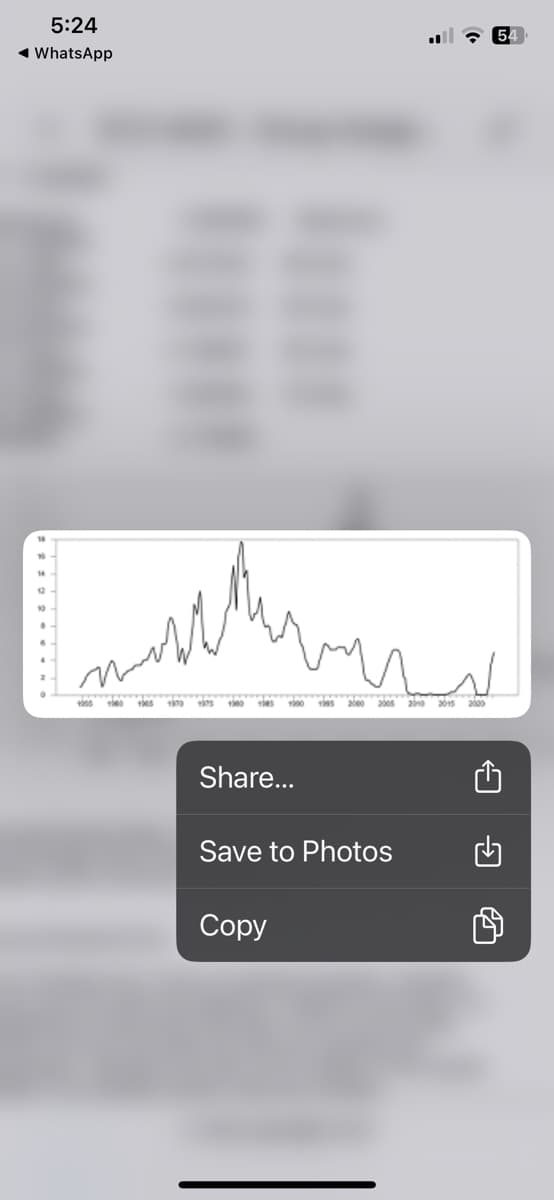
1905
1160
15
Share...
1995 2000 2005 2010 2015 2000
Save to Photos
Copy
Expert Solution
This question has been solved!
Explore an expertly crafted, step-by-step solution for a thorough understanding of key concepts.

Step by step
Solved in 4 steps with 5 images

Recommended textbooks for you
Algebra for College Students
Algebra
ISBN:
9781285195780
Author:
Jerome E. Kaufmann, Karen L. Schwitters
Publisher:
Cengage Learning

Mathematics For Machine Technology
Advanced Math
ISBN:
9781337798310
Author:
Peterson, John.
Publisher:
Cengage Learning,

Algebra for College Students
Algebra
ISBN:
9781285195780
Author:
Jerome E. Kaufmann, Karen L. Schwitters
Publisher:
Cengage Learning
Mathematics For Machine Technology
Advanced Math
ISBN:
9781337798310
Author:
Peterson, John.
Publisher:
Cengage Learning,

Algebra & Trigonometry with Analytic Geometry
Algebra
ISBN:
9781133382119
Author:
Swokowski
Publisher:
Cengage