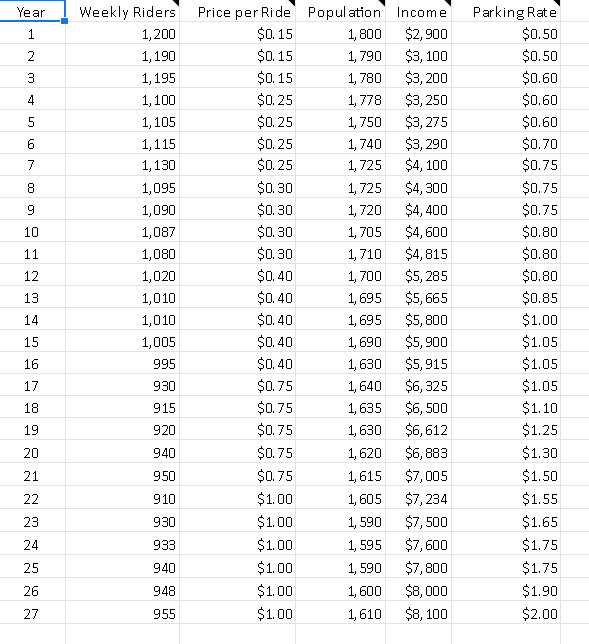
The director of a public bus company was asked by the city council to explain the factors that influence the demand for public transportation in her company. The director wanted to support her intuition with evidence so she collected data on variables she believed could have a significant relationship to the number of weekly passengers that rode the bus service. Besides the weekly number of riders, she collected data about the price per ride, city population, population income, and parking costs. The file P10 20.xlsx L contains these data. a. Estimate a multiple regression equation using the given data. Interpret each of the estimated regression coefficients. Holding all else constant, ridership [Select ] by approximately [ Select] thousands when the price per ride rises by $1.00. Holding all else constant, ridership ( Select] by approximately [ Select] thousands when the population increases by 1,000. Holding all else constant, ridership (Select ] by approximately ( Select] thousands when the disposable per capita income rises by $1.00. Holding all else constant, ridership [ Select] by approximately [ Select ] thousands when the parking rate rises by $1.00. b. What proportion of the total variation in the number of weekly riders is explained by this estimated multiple regression equation? ANSWER: [ Select]
The director of a public bus company was asked by the city council to explain the factors that influence the demand for public transportation in her company. The director wanted to support her intuition with evidence so she collected data on variables she believed could have a significant relationship to the number of weekly passengers that rode the bus service. Besides the weekly number of riders, she collected data about the price per ride, city population, population income, and parking costs. The file P10 20.xlsx L contains these data. a. Estimate a multiple regression equation using the given data. Interpret each of the estimated regression coefficients. Holding all else constant, ridership [Select ] by approximately [ Select] thousands when the price per ride rises by $1.00. Holding all else constant, ridership ( Select] by approximately [ Select] thousands when the population increases by 1,000. Holding all else constant, ridership (Select ] by approximately ( Select] thousands when the disposable per capita income rises by $1.00. Holding all else constant, ridership [ Select] by approximately [ Select ] thousands when the parking rate rises by $1.00. b. What proportion of the total variation in the number of weekly riders is explained by this estimated multiple regression equation? ANSWER: [ Select]

Linear Algebra: A Modern Introduction
4th Edition
ISBN:9781285463247
Author:David Poole
Publisher:David Poole
Chapter7: Distance And Approximation
Section7.3: Least Squares Approximation
Problem 31EQ

Related questions
Question
Help me please
Transcribed Image Text:Weekly Riders
Price per Ride Population Income
$. 15
$0. 15
$0. 15
Year
Parking Rate
1,200
1, 800
$2,900
$0.50
$3, 100
$3, 200
$3, 250
$3, 275
$3, 290
$4, 100
$4, 300
$4, 400
$4, 600
2
1,190
1, 790
$0.50
3.
1,195
1, 780
$0.60
4
1, 100
$0.25
1, 778
$0.60
$0. 25
$0. 25
$0.25
1,105
1, 750
$0.60
$0.70
$0.75
1,115
1, 740
7
1,130
1, 725
8
1,095
$0.30
1, 725
$0.75
1,090
$0.30
1, 720
$0.75
10
1,087
$0.30
1, 705
$0.80
11
1,080
$0.30
1, 710
$4,815
$0.80
$5, 285
$5, 665
$5, 800
$5, 900
$5, 915
$6, 325
$6, 500
$6, 612
$6, 883
12
1,020
$0.40
1, 700
$0.80
13
1,010
$0.40
1, 695
$0.85
14
1,010
$0.40
1, 695
$1.00
15
1,005
$0. 40
1, 690
$1.05
16
995
$0.40
1, 630
$1.05
17
930
$0.75
1, 640
$1.05
18
915
$0.75
1, 635
$1.10
19
920
$0.75
1, 630
$1.25
20
940
$0.75
1, 620
$1.30
21
950
$0.75
1,615
$7,005
$1.50
22
910
$1.00
1, 605
$7, 234
$1.55
$7, 500
$7, 600
23
930
$1.00
1, 590
$1.65
24
933
$1.00
1, 595
$1.75
25
940
$1.00
1, 590
$7, 800
$1.75
26
948
$1.00
1, 600
$8,000
$1.90
27
955
$1.00
1,610
$8, 100
$2.00
1,
![The director of a public bus company was asked by the city council to explain
the factors that influence the demand for public transportation in her
company. The director wanted to support her intuition with evidence so she
collected data on variables she believed could have a significant relationship
to the number of weekly passengers that rode the bus service. Besides the
weekly number of riders, she collected data about the price per ride, city
population, population income, and parking costs. The file P10 20.xlsx !
contains these data.
a. Estimate a multiple regression equation using the given data. Interpret
each of the estimated regression coefficients.
Holding all else constant, ridership
[ Select]
by
approximately [ Select]
thousands when the price
per ride rises by $1.00.
Holding all else constant, ridership
[ Select]
by
approximately
[ Select]
thousands when the
population increases by 1,000.
Holding all else constant, ridership
[ Select ]
by
approximately (Select ]
thousands when the
disposable per capita income rises by $1.00.
Holding all else constant, ridership [ Select ]
by
approximately [ Select ]
thousands when the
parking rate rises by $1.00.
b. What proportion of the total variation in the number of weekly riders is
explained by this estimated multiple regression equation? ANSWER:
[ Select]](/v2/_next/image?url=https%3A%2F%2Fcontent.bartleby.com%2Fqna-images%2Fquestion%2Fb96f2eb1-71ac-426b-b908-b8853d447a19%2F9e5a5b16-b99a-4fd6-bfd3-19c52c7cd8a5%2Fee6587o_processed.png&w=3840&q=75)
Transcribed Image Text:The director of a public bus company was asked by the city council to explain
the factors that influence the demand for public transportation in her
company. The director wanted to support her intuition with evidence so she
collected data on variables she believed could have a significant relationship
to the number of weekly passengers that rode the bus service. Besides the
weekly number of riders, she collected data about the price per ride, city
population, population income, and parking costs. The file P10 20.xlsx !
contains these data.
a. Estimate a multiple regression equation using the given data. Interpret
each of the estimated regression coefficients.
Holding all else constant, ridership
[ Select]
by
approximately [ Select]
thousands when the price
per ride rises by $1.00.
Holding all else constant, ridership
[ Select]
by
approximately
[ Select]
thousands when the
population increases by 1,000.
Holding all else constant, ridership
[ Select ]
by
approximately (Select ]
thousands when the
disposable per capita income rises by $1.00.
Holding all else constant, ridership [ Select ]
by
approximately [ Select ]
thousands when the
parking rate rises by $1.00.
b. What proportion of the total variation in the number of weekly riders is
explained by this estimated multiple regression equation? ANSWER:
[ Select]
Expert Solution
This question has been solved!
Explore an expertly crafted, step-by-step solution for a thorough understanding of key concepts.

This is a popular solution!

Trending now
This is a popular solution!

Step by step
Solved in 5 steps with 2 images

Recommended textbooks for you
Linear Algebra: A Modern Introduction
Algebra
ISBN:
9781285463247
Author:
David Poole
Publisher:
Cengage Learning

Glencoe Algebra 1, Student Edition, 9780079039897…
Algebra
ISBN:
9780079039897
Author:
Carter
Publisher:
McGraw Hill

Functions and Change: A Modeling Approach to Coll…
Algebra
ISBN:
9781337111348
Author:
Bruce Crauder, Benny Evans, Alan Noell
Publisher:
Cengage Learning
Linear Algebra: A Modern Introduction
Algebra
ISBN:
9781285463247
Author:
David Poole
Publisher:
Cengage Learning
Glencoe Algebra 1, Student Edition, 9780079039897…
Algebra
ISBN:
9780079039897
Author:
Carter
Publisher:
McGraw Hill
Functions and Change: A Modeling Approach to Coll…
Algebra
ISBN:
9781337111348
Author:
Bruce Crauder, Benny Evans, Alan Noell
Publisher:
Cengage Learning

Big Ideas Math A Bridge To Success Algebra 1: Stu…
Algebra
ISBN:
9781680331141
Author:
HOUGHTON MIFFLIN HARCOURT
Publisher:
Houghton Mifflin Harcourt

Holt Mcdougal Larson Pre-algebra: Student Edition…
Algebra
ISBN:
9780547587776
Author:
HOLT MCDOUGAL
Publisher:
HOLT MCDOUGAL