The director of marketing at Vanguard Corporation believes that sales of the company's Bright Side laundry detergent (S) are related to Vanguard's own advertising expenditure (A), as well as the combined advertising expenditures of its three biggest rival detergents (R). The marketing director collects 36 weekly observations on S, A, and R to estimate the following multiple regression equation: S = a + bA + cR where S, A, and R are measured in dollars per week. Vanguard's marketing director is comfortable using parameter estimates that are statistically significant at the 10 percent level or better. a. What sign does the marketing director expect a, b, and c to have? b. Interpret the coefficeints a, b, and c. The regression output from the computer is as follows: c. Does Vanguard's advertising expenditure have a statistically significant effect on the sales of Bright Side detergent? Explain, using the appropriate P-value. d. Does advertising by its three largest rivals affect sales of Bright Side detergent in a statistically significant way? Explain, using the appropriate P-value. e. What fraction of the total variation in sales of Bright Side remains unexplained? What can the marketing director do to increase the explanatory power of the sales equation? What other explanatory variables might be added to this equation? f. What is the expected level of sales each week when Vanguard spends $40,000 per week and the combined advertising expenditures for the three rivals are $100,000 per week? Please answer the d, e, and f questions.


The director of marketing at Vanguard Corporation believes that sales of the company's Bright Side laundry detergent (S) are related to Vanguard's own advertising expenditure (A), as well as the combined advertising expenditures of its three biggest rival detergents (R). The marketing director collects 36 weekly observations on S, A, and R to estimate the following multiple regression equation:
S = a + bA + cR
where S, A, and R are measured in dollars per week. Vanguard's marketing director is comfortable using parameter estimates that are statistically significant at the 10 percent level or better.
a. What sign does the marketing director expect a, b, and c to have?
b. Interpret the coefficeints a, b, and c.
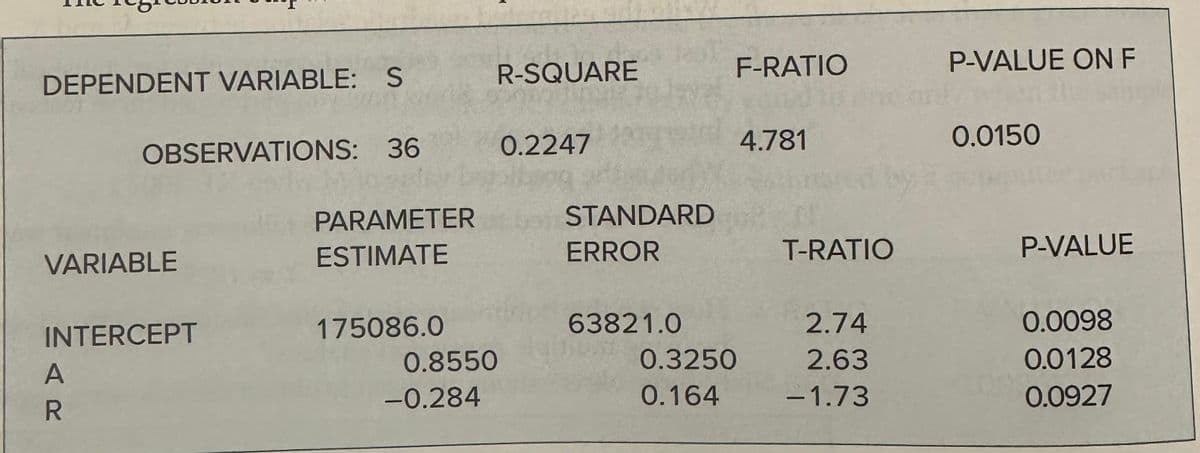
The regression output from the computer is as follows:
c. Does Vanguard's advertising expenditure have a statistically significant effect on the sales of Bright Side detergent? Explain, using the appropriate P-value.
d. Does advertising by its three largest rivals affect sales of Bright Side detergent in a statistically significant way? Explain, using the appropriate P-value.
e. What fraction of the total variation in sales of Bright Side remains unexplained? What can the marketing director do to increase the explanatory power of the sales equation? What other explanatory variables might be added to this equation?
f. What is the expected level of sales each week when Vanguard spends $40,000 per week and the combined advertising expenditures for the three rivals are $100,000 per week?
Please answer the d, e, and f questions.

Step by step
Solved in 5 steps with 7 images


