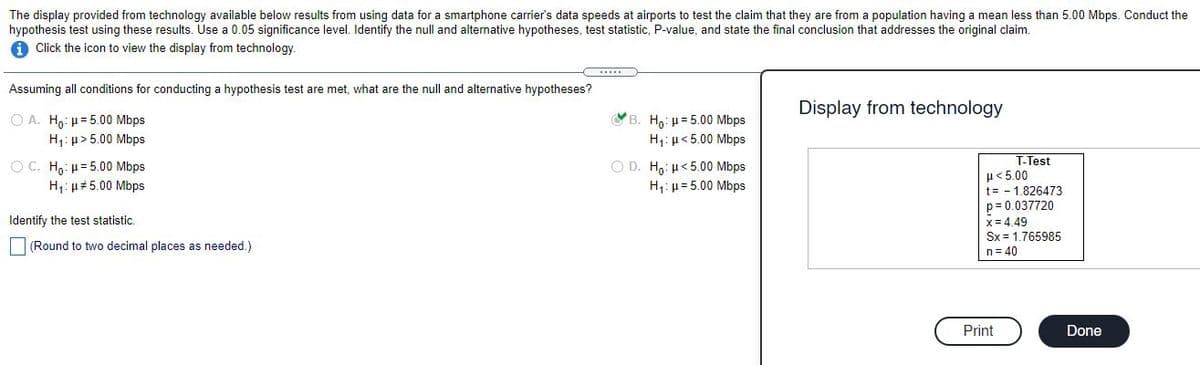
The display provided from technology available below results from using data for a smartphone carrier's data speeds at airports to test the claim that they are from a population having a mean less than 5.00 Mbps. Conduct th hypothesis test using these results. Use a 0.05 significance level. Identify the null and alternative hypotheses, test statistic, P-value, and state the final conclusion that addresses the original claim.


Q: If the p-value = 0.04 at a 3% significance level, what is the conclusion? O Not enough information…
A: According to the given information in this question We need to identify the correct option
Q: A study was undertaken to examine the tensile strength of a new type of polyester fibre. Where…
A: We have given that Sample size n =30 Population mean =0.26
Q: In a study of the accuracy of fast food drive-through orders, one restaurant had 36 orders that were…
A: State the hypotheses. That is, the proportion rate of inaccurate orders is equals to 0.10. That…
Q: DermioPizza claims that the average pizza delivery time by its staff is less than 30 minutes. To…
A: Let μ denotes the population mean pizza delivery time. The claim is that the average delivery time…
Q: In a study of high school students at least 16 years of age, researchers obtained survey results…
A: Note: According to Bartleby guidelines expert solve only one question and maximum 3 subpart of the…
Q: In a study of the accuracy of fast food drive-through orders, one restaurant had 36 orders that were…
A: Given Data
Q: In the past, the mean running time for a certain type of flashlight battery has been 7.5 hours.…
A: From the provided information, Sample size (n) = 40 Sample mean (x̅) = 7.7 Population standard…
Q: a production line operation is designed to fill cartons with laundry detergent to a meanweight of 32…
A:
Q: A public bus company official claims that the mean waiting time for bus number 14 during peak hours…
A:
Q: A rods manufacturer makes rods with a length that is supposed to be 16 inches. A quality control…
A: the sample mean length , x =16.07 inches sample standard deviation , s = 0.22 A rods manufacturer…
Q: The accompanying table shows results of challenged referee calls in a major tennis tournament. Use a…
A: Null Hypothesis, H0 : The gender of the tennis player is independent of whether a call is…
Q: The data is from 80 universities and colleges. If total costs are higher at private colleges one…
A: Since you have posted a question with multiple sub-parts, we will solve first three subparts for…
Q: rods manufacturer makes rods with a length that is supposed to be 10 inches. A quality control…
A:
Q: A study of seat belt users and nonusers yielded the randomly selected sample data summarized in the…
A:
Q: The accompanying data are drive-through service times (seconds) recorded at a fast food restaurant…
A:
Q: Use the pulse rates in beats per minute (bpm) of a random sample of adult females listed in the data…
A: Hypothesis to be tested: H0:μ=77 bpmH1:μ<77 bpm
Q: In a study of high school students at least 16 years of age, researchers obtained survey results…
A:
Q: The display provided from technology available below results from using data for a smartphone…
A: The null hypothesis is defined by the claim of the corresponding organization or company. On the…
Q: Because of high production-changeover time and costs, a director of manufacturing must convince…
A:
Q: Identify the null hypothesis, alternative hypothesis, test statistic, P-value, conclusion about the…
A:
Q: Because of high production-changeover time and costs, a director of manufacturing must convince…
A:
Q: In a study of the accuracy of fast food dive-through orders, one restaurant had 38 orders that were…
A:
Q: f we are running a hypothesis test to see if the true mean breaking strength of Acme rope exceeds…
A:
Q: In a study of high school students at least 16 years of age, researchers obtained survey results…
A: It is needed to test the claim of independence between texting while driving and driving when…
Q: A Sample of 150 homes for sale in ABC City show a mean asking price of $233,000 but the city claim…
A: Given information Sample mean = 233000 Hypothesized mean = 255000 Population standard deviation =…
Q: Use the pulse rates beats per minute (bpm) of a random sample of adult females listed in the data…
A: We have find givan hypothesis...
Q: In a study of the accuracy of fast food drive-through orders, one restaurant had 30 orders that were…
A: Solution: State the hypotheses Null hypothesis: That is, the rate of inaccurate orders is equal to…
Q: A production line operation is designed to fill cartons with laundry detergent to a mean weight of…
A: Solution
Q: Do the data provide evidence that the training program is effective in increasing supervisory…
A: Since both the samples are dependent, we need to use paired t test.
Q: If indeed the true mean exposure time is 8h/day but for the randomly selected CSU students that are…
A: Here, a indeed the true mean exposure time is 8h/day The randomly selected CSU students that are…
Q: In a clinical trial, 227 subjects were treated with a pain medicine and 52 of them developed nausea.…
A: Givensample size(n)=227x=52p^=xn=52227=0.2291α=0.05
Q: Identify the null hypothesis, alternative hypothesis, test statistic, P -value, conclusion about the…
A: In order to determine whether the population mean weight of all employees is less than 200 lb or…
Q: Consider a drug that is used to help prevent blood clots in certain patients. In clinical trials,…
A: Denote p as the true population proportion of users who develop nausea.
Q: The quality-control manager at a light bulb factory needs to determine whether the mean life of…
A:
Q: A safety administration conducted crash tests of child booster seats for cars. Listed below are…
A: Given data : 670 603 1014 534 501 662
Q: For the given significance test, explain the meaning of a Type I error, a Type Il error, or a…
A: The Type II error occurs if someone does not reject the false Ho, even if it is totally incorrect.
Q: A new treatment for a severe allergy is claimed to have a better cure rate than the standard of…
A: One prop Z test is applicable
Q: a production line operation is designed to fill cartons with laundry detergent to a meanweight of 32…
A: a. The given information is that the mean weight is 32 ounces. Here, the claim is that overfilling…
Q: Use the pulse rates in beats per minute (bpm) of a random sample of adult females listed in the data…
A: From the provided we have,
Q: A study was undertaken to examine the tensile strength of a new type of polyester fibre. Where…
A:
Q: Historically, the percentage of U.S. residents who support stricter gun control laws has been 55%. A…
A: Given : Claim : The proportion of those favoring stricter gun control has changed from 0.55.
Q: Can you help me solve these 3 questions using Statcrunch? please and thank you! Identify the null…
A:
Q: The alkaline batteries of a toy car were designed to last 30 hours, on average. However lots of…
A: Given: n= 38.0 ,x̄= 29.3 ,s= 2.8 µ= 30.0 ,significance level(∝)= 0.05
Q: A survey administered in a certain socioeconomic group gathered information to assess self-esteem of…
A:
Q: Use the pulse rates in beats per minute (bpm) of a random sample of adult females listed in the data…
A: Given that μ=73x¯=69.8, from the excel function, =AVERAGE(G1:G50)s=19.8536, from the excel function,…
Q: A study of seat belt users and nonusers yielded the randomly selected sample data summarized in the…
A: Solution: From the given information, the claim is that the amount of smoking independent of seat…
Q: A random sample of 319 front-seat occupants involved in head-on collisions in a certain region…
A: Hypothesis: H0:p=0.25H1:p>0.25 Test Statistic: Test…
Q: A random sample of vehicle speeds were collected. Use the data to test the claim that the mean…
A: 1. Consider that μ is the population mean speed of all vehicles.
Q: In a study of the accuracy of fast food drive-through orders, one restaurant had 40 orders that…
A:
Q: A recent survey showed that from a sample of 500 packages delivered by a Postal Service, 480 were…
A:
9;


Trending now
This is a popular solution!

Step by step
Solved in 2 steps

- Can you help me solve these 3 questions using Statcrunch? please and thank you! Identify the null hypothesis, alternative hypothesis, test statistic, P-value, conclusion about the null hypothesis, and final conclusion that addresses the original claim. 23) The health of employees is monitored by periodically weighing them in. A sample of 54 employees has a mean weight of 183.9 lb. Assuming that CJ is known to be 121.2 lb, use a 0.10 significance level to test the claim that the population mean of all such employees weights is less than 200 lb. MULTIPLE CHOICE. Choose the one alternative that best completes the statement or answers the question. Do one of the following, as appropriate: (a) Find the critical value Za/2- (b) find the critical value ta/2- (c) state that neither the normal nor the t distribution applies. 24) 99%; n = 17; CJ is unknown; population appears to be normally distributed. A) Za./2 = 2.583 B) Za/2 = 2.567 C) ta/2 = 2.898 D) ta./2 = 2.921 Use the given degree of…An engineer has designed a valve that will regulate water pressure on an automobile engine. The valve was tested on 170 engines and the mean pressure was 4.7 pounds/square inch (psi). Assume the population variance is 1.00. If the valve was designed to produce a mean pressure of 4.5 psi, is there sufficient evidence at the 0.05 level that the valve does not perform to the specifications? Step 5 of 6: Identify the level of significance for the hypothesis test.A survey carried out by John claims that the average cost of living for households in City 1 is more than that in City 2: (a) Specify the competing hypotheses to test John's claim. (b) Calculate the value of the test statistic. (c) At the 5% significance level, is John's claim supported by the data? Explain
- Identify the null hypothesis, alternative hypothesis, test statistic, P -value, conclusion about the null hypothesis, and final conclusion that addresses the original claim. The health of employees is monitored by periodically weighing them in. A sample of 54 employees has a mean weight of 183.9 lb. Assuming that a is known to be 121.2 lb, use a 0.10 significance level to test the claim that the population mean of all such employees weights is less than 200 lb.Researchers investigated whether a new process for producing yarn could reduce the mean amount of volatile organic compounds (VOCs) emitted by carpet. From random samples of carpets, the researchers found the mean reduction of VOCs emitted by carpets made with yarn produced by the new process compared with that of carpets made with yarn produced by the traditional process was 13 parts per million (ppm). All conditions for inference were met, and the p-value for the appropriate hypothesis test was 0.095. Which of the following statements is the best interpretation of the p-value? (A) The probability that the null hypothesis is true is 0.095. (B) The probability that the alternative hypothesis is true is 0.095. (C) The probability of observing a mean reduction of 13 ppm is 0.095.(D) If the null hypothesis is true, the probability of observing a mean reduction of at least 13 ppm is 0.095. (E) If the null hypothesis is true, the probability of observing a mean reduction of at most 13 ppm…A sample of 45 households reveals that 23% have traveled overseas. Is this significantly different from a hypothesized value of 30%, which characterizes the entire country? Use a significance level of 0.05. Write down the null and alternative hypotheses, find the test statistic and the p-value, and state your conclusion.
- In a sample of 1050 adults, it was found that 52% are registered to vote in their state. Use a 0.05 significance level to test the claim that less than 50% of all adults are registered to vote in their state.a. Find the test statistic.b. Find the critical value.c. Find the p-value.d. What is the conclusion about the null hypothesis (reject or fail to reject)?e. What is the final conclusion in nontechnical terms?In a study of the accuracy of fast food drive-through orders, one restaurant had 33 orders that were not accurate among 389 orders observed. Use a 0.05 significance level to test the claim that the rate of inaccurate orders is equal to 10%. Does the accuracy rate appear to be acceptable? Identify the null and alternative hypotheses for this test. Choose the correct answer below. A. H0: p=0.1 H1: p<0.1 B. H0: p=0.1 H1: p>0.1 C. H0: p≠0.1 H1: p=0.1 D. H0: p=0.1 H1: p≠0.1 Identify the test statistic for this hypothesis test. The test statistic for this hypothesis test is nothing. (Round to two decimal places as needed.) Identify the P-value for this hypothesis test. The P-value for this hypothesis test is nothing. (Round to three decimal places as needed.) Identify the conclusion for this hypothesis test. A. Fail to reject H0. There is sufficient evidence to warrant rejection of the claim that the rate of…A production line operation is designed to fill cartons with laundry detergent to a mean weight of 64 ounces. A sample of cartons is periodically selected and weighed to determine whether underfilling or overfilling is occurring. If the sample data lead to a conclusion of underfilling or overfilling, the production line will be shut down and adjusted to obtain proper filling. (a) Formulate the null and alternative hypotheses that will help in deciding whether to shut down and adjust the production line. H0: ? ≥ 64 Ha: ? < 64 H0: ? = 64 Ha: ? < 64 H0: ? ≤ 64 Ha: ? > 64 H0: ? = 64 Ha: ? > 64 H0: ? = 64 Ha: ? ≠ 64 (b) Comment on the conclusion and the decision when H0 cannot be rejected. Conclude that there is statistical evidence that the production line is not operating properly. Do not allow the production process to continue.Conclude that there is statistical evidence that the production line is not operating properly. Allow the production process to…
- Recently, a large academic medical center determined that 13 of 20 employees in a particular position were female, whereas 41% of the employees for this position in the general workforce were female. At the 0.01 level of significance, is there evidence that the proportion of females in this position at this medical center is different from what would be expected in the general workforce? Question content area bottom Part 1 What are the correct hypotheses to test to determine if the proportion is different? A. H0: π≤0.41; H1: π>0.41 B. H0: π≥0.41; H1: π<0.41 C. H0: π=0.41; H1: π≠0.41 D. H0: π≠0.41; H1: π=0.41 Part 2 Calculate the test statistic. ZSTAT=enter your response here (Type an integer or a decimal. Round to two decimal places as needed.) Part 3 What is the p-value? The p-value is enter your response here. (Type an integer or a decimal. Round to three decimal places as needed.) Part 4 State…In a study of the accuracy of fast food drive-through orders, one restaurant had 34 orders that were not accurate among 378 orders observed. Use a 0.05 significance level to test the claim that the rate of inaccurate orders is equal to 10%. Does the accuracy rate appear to be acceptable? Identify the null and alternative hypotheses for this test. Choose the correct answer below. A. H0: p≠0.1 H1: p=0.1 B. H0: p=0.1 H1: p>0.1 C. H0: p=0.1 H1: p≠0.1 Your answer is correct. D. H0: p=0.1 H1: p<0.1 Identify the test statistic for this hypothesis test. The test statistic for this hypothesis test is negative 0.65−0.65. (Round to two decimal places as needed.) Identify the P-value for this hypothesis test. The P-value for this hypothesis test is ---? (Round to three decimal places as needed.)In a study of the accuracy of fast food drive-through orders, one restaurant had 33 orders that were not accurate among 398 orders observed. Use a 0.05 significance level to test the claim that the rate of inaccurate orders is equal to 10%. Does the accuracy rate appear to be acceptable? Identify the null and alternative hypotheses for this test. Choose the correct answer below. A. H0: p=0.1 H1: p>0.1 B. H0: p=0.1 H1: p<0.1 C. H0: p=0.1 H1: p≠0.1 D. H0: p≠0.1 H1:p= Identify the test statistic for this hypothesis test. The test statistic for this hypothesis test is _____ (Round to two decimal places as needed.) Identify the P-value for this hypothesis test. The P-value for this hypothesis test is ____ (Round to three decimal places as needed.) Identify the conclusion for this hypothesis test. A. Reject H0. There is sufficient evidence to warrant rejection of the claim that the rate of inaccurate orders is equal to 10%.…