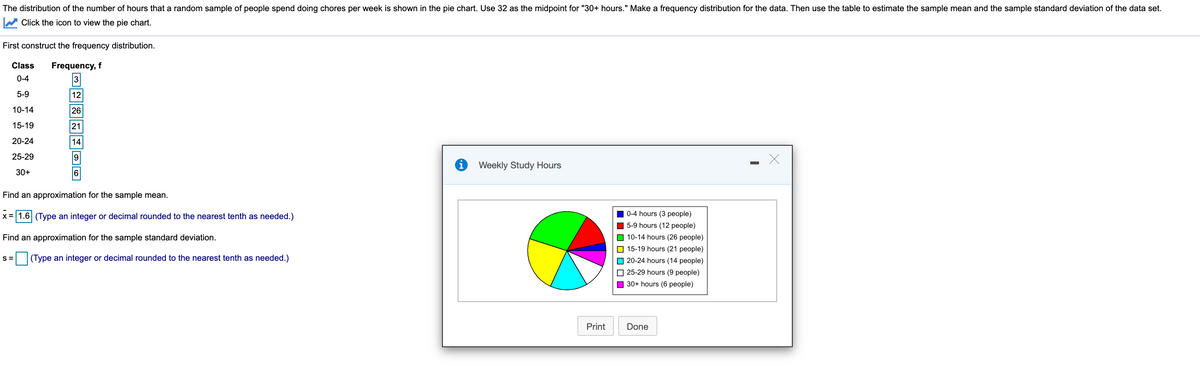
The distribution of the number of hours that a random sample of people spend doing chores per week is shown in the pie chart. Use 32 as the midpoint for "30+ hours." Make a frequency distribution for the data. Then use the table to estimate the sample mean and the sample standard deviation of the data set. W Click the icon to view the pie chart. First construct the frequency distribution. Class Frequency, f 04 5-9 12 10-14 26 15-19 21 20-24 14 25-29 O Weekly Study Hours 30 Find an approximation for the sample mean. x= 1.6 (Type an integer or decimal rounded to the nearest tenth as needed.) 104 hours (3 people) I59 hours (12 people) O 10-14 hours (26 people) O 15-19 hours (21 people) O 20-24 hours (14 people) O 25-29 hours (9 people) I30 hours (6 people) Find an approximation for the sample standard deviation. s-(Type an integer or decimal rounded to the nearest tenth as needed.) Print Done


Inverse Normal Distribution
The method used for finding the corresponding z-critical value in a normal distribution using the known probability is said to be an inverse normal distribution. The inverse normal distribution is a continuous probability distribution with a family of two parameters.
Mean, Median, Mode
It is a descriptive summary of a data set. It can be defined by using some of the measures. The central tendencies do not provide information regarding individual data from the dataset. However, they give a summary of the data set. The central tendency or measure of central tendency is a central or typical value for a probability distribution.
Z-Scores
A z-score is a unit of measurement used in statistics to describe the position of a raw score in terms of its distance from the mean, measured with reference to standard deviation from the mean. Z-scores are useful in statistics because they allow comparison between two scores that belong to different normal distributions.


Trending now
This is a popular solution!

Step by step
Solved in 2 steps with 3 images


