The dotplot below dis plays the difference in scores for 18 games between a high school soccer team and its opponent. Difference in Score -2 -1 0 1 2 3 4 Team Score Minus Opponent Score Which of the following best describes the shape of the distribution? skewed to the left bimodal symmetric skewed to the right O unimodal symmetric •.-
The dotplot below dis plays the difference in scores for 18 games between a high school soccer team and its opponent. Difference in Score -2 -1 0 1 2 3 4 Team Score Minus Opponent Score Which of the following best describes the shape of the distribution? skewed to the left bimodal symmetric skewed to the right O unimodal symmetric •.-

Glencoe Algebra 1, Student Edition, 9780079039897, 0079039898, 2018
18th Edition
ISBN:9780079039897
Author:Carter
Publisher:Carter
Chapter10: Statistics
Section10.4: Distributions Of Data
Problem 19PFA

Related questions
Question
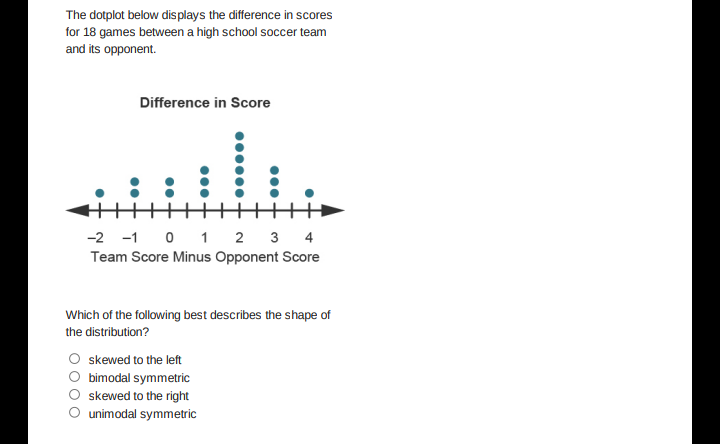
Transcribed Image Text:The dotplot below dis plays the difference in scores
for 18 games between a high school soccer team
and its opponent.
Difference in Score
-2 -1 0 1 2 3 4
Team Score Minus Opponent Score
Which of the following best describes the shape of
the distribution?
skewed to the left
bimodal symmetric
skewed to the right
O unimodal symmetric
•.-
Expert Solution
This question has been solved!
Explore an expertly crafted, step-by-step solution for a thorough understanding of key concepts.

This is a popular solution!

Trending now
This is a popular solution!

Step by step
Solved in 2 steps with 2 images

Recommended textbooks for you
Glencoe Algebra 1, Student Edition, 9780079039897…
Algebra
ISBN:
9780079039897
Author:
Carter
Publisher:
McGraw Hill

Big Ideas Math A Bridge To Success Algebra 1: Stu…
Algebra
ISBN:
9781680331141
Author:
HOUGHTON MIFFLIN HARCOURT
Publisher:
Houghton Mifflin Harcourt
Glencoe Algebra 1, Student Edition, 9780079039897…
Algebra
ISBN:
9780079039897
Author:
Carter
Publisher:
McGraw Hill
Big Ideas Math A Bridge To Success Algebra 1: Stu…
Algebra
ISBN:
9781680331141
Author:
HOUGHTON MIFFLIN HARCOURT
Publisher:
Houghton Mifflin Harcourt